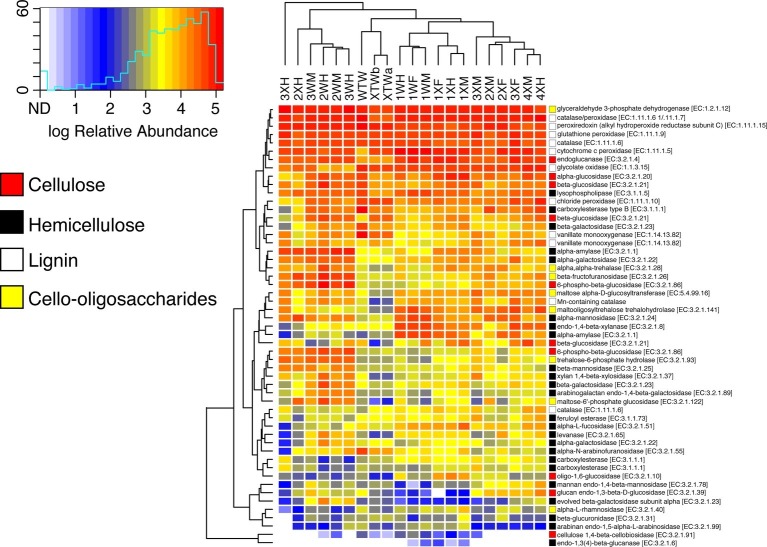
Figure 5.
Relative abundance of lignocellulose-active enzymes across diet and tissue type. OTUs were picked against the Greengenes 13_8 16S rRNA database. Predictive metagenomics was performed using Tax4Fun, and heatmaps were generated in R using the heatmap.2 function of the gplots package. Cell color indicates relative abundance among all predicted genes. Colored squares to the right of the heatmap correspond with type of substrate the enzyme is active against. For instances of duplicated E.C. numbers, each row represents a different entry in the KEGG database, each with a unique K-number.

