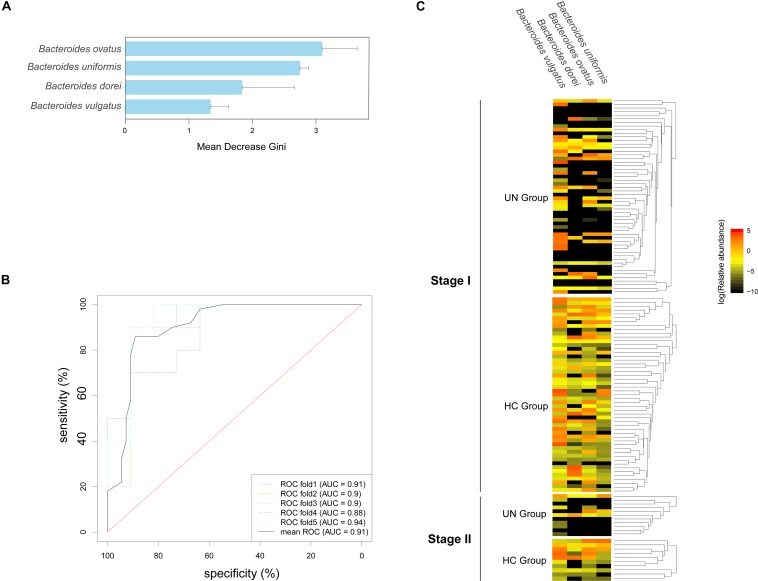
FIGURE 4.
Species markers and their accuracy in differentiating the UN group from the HC group. (A) Four species were identified for the optimal classification of the HC and UN children at stage I; the Gini values are plotted. (B) The accuracy of the species markers was evaluated by using the samples from stage II, and ROC curves were drawn with five repeats in different colors along with AUC values. (C) The relative abundances of the biomarkers in all samples are shown with a heatmap.

