FIGURE 5.
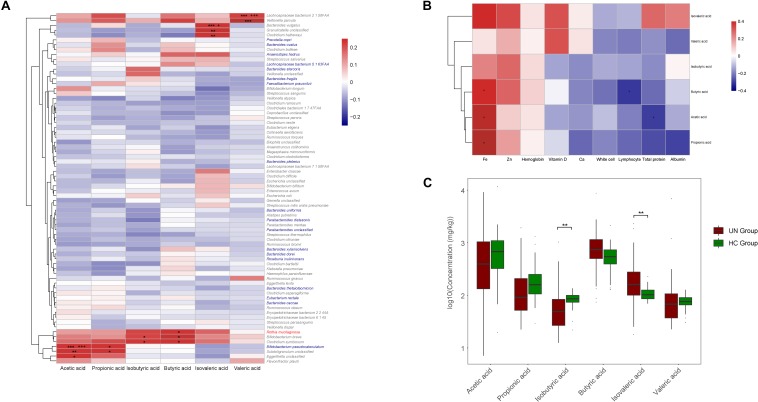
Correlations among GM, SCFAs, and nutritional indicators. (A) The positive and negative relationships between GM and SCFAs are exhibited with red and blue boxes, respectively. Significant relationships are indicated with “∗” or “+.” ∗P < 0.05, ∗∗P < 0.01, ∗∗∗P < 0.001, +FDR < 0.05, and + + + FDR < 0.001. Species labeled in red or blue were enriched in the UN or HC groups, and, for species labeled in gray, no significant differences were observed between these two groups. (B) The relationships between SCFAs and nutritional indicators were also explored. Red and blue boxes stand for positive and negative relationships, respectively, and ∗P < 0.05. (C) Comparison between the concentrations of SCFAs of the UN and HC groups. ∗∗P < 0.01.

