Figure 1.

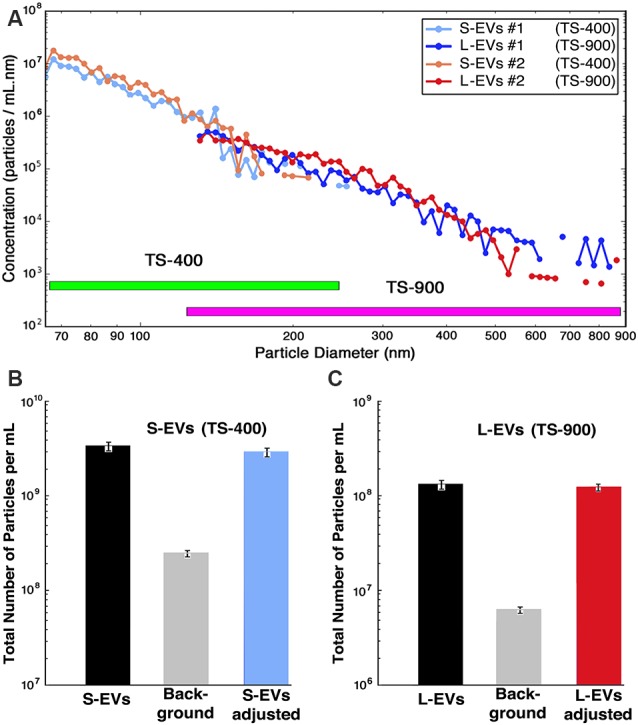
Counting and sizing HEI-OC1 extracellular vesicles (HEI-OC1 EVs). (A) Computer-generated concentration spectral density (CSD) vs. particle size for two independent samples (S1 and S2) in the whole size range. Values for S1 and S2 are already corrected by bin-by-bin background subtraction of the values obtained from matched CM+ED-FBS and PBS+0.1% BSA (see Supplementary Figure S1). Note that the TS-400 and TS-900 cartridges have an overlapping region. (B) Bar graphic depicting the total number of particles in the small-EVs (S-EVs) fraction [average of S1 and S2 = (3.3 ± 0.1) × 109 particles/ml], the total background [(1.30 ± 0.04) × 108 particles/ml for CM+ED-FBS plus (1.35 ± 0.08) × 108 particles/ml for PBS+0.1% BSA = (2.65 ± 0.12) × 108 particles/ml], and average of adjusted values [(3.3 ± 0.1) × 109 – (2.65 ± 0.12) × 108 = (3.0 ± 0.2) × 109 particles/ml]. (C) Bar graphs depicting the total number of particles in the large-EVs (L-EVs) fraction [average of S1 and S2 = (1.39 ± 0.07) × 108 particles/ml], the total background [(4.8 ± 0.2) × 105 particles/ml for CM+ED-FBS plus (5.3 ± 0.4) × 106 particles/ml for PBS+0.1% BSA = (5.8 ± 0.6) × 106 particles/ml], and average of adjusted values [(1.39 ± 0.69) × 108 – (5.8 ± 0.6) × 106 = (1.3 ± 0.7) × 108 particles/ml]. Note that in all panels the scale of the Y-axis is logarithmic, but panel (A) is in CSD units (particles/ml.nm) whereas panels (B,C) are in absolute concentration units (particles/ml).
