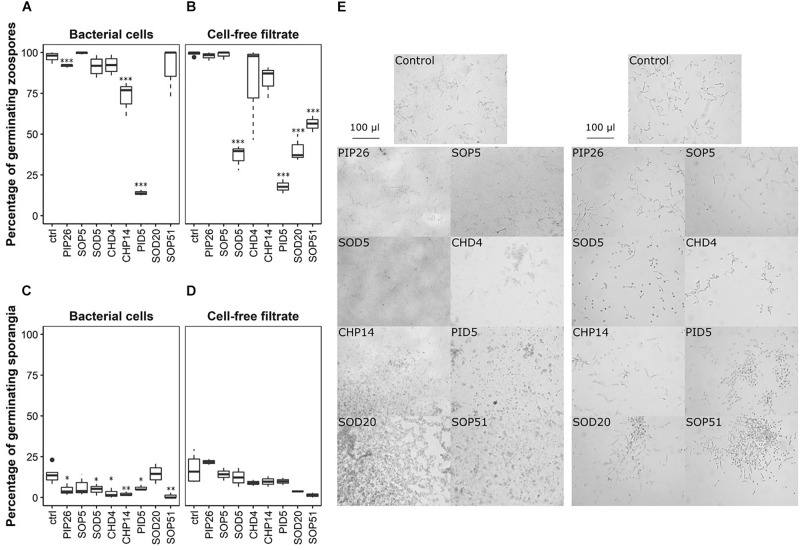
FIGURE 6.
Inhibition of zoospore and sporangia germination of P. infestans. Percentages of germinated zoospores observed after 4 h upon exposure to bacterial cells are shown in (A), those observed upon exposure to cell-free filtrates are shown in (B). Percentages of germinated sporangia after 24 h upon exposure to bacterial cells and to cell-free filtrates are shown in (C,D) respectively. Stars indicate significant difference in germination percentage compared with the respective control (ctrl) according to a t-test (∗p < 0.05; ∗∗p < 0.01; ∗∗∗p < 0.001). Both experiments were replicated once, generating two datasets of which one is represented in this figure, and three technical replicates were prepared, except for the effect of the cell-free filtrates on sporangia germination, for which only two technical replicates were analyzed. Per technical replicate, one picture was taken and analyzed. Representative pictures of zoospores co-incubated with bacterial cells (left) or cell-free filtrates (right) are shown in (E). The experiment was repeated twice with similar results.

