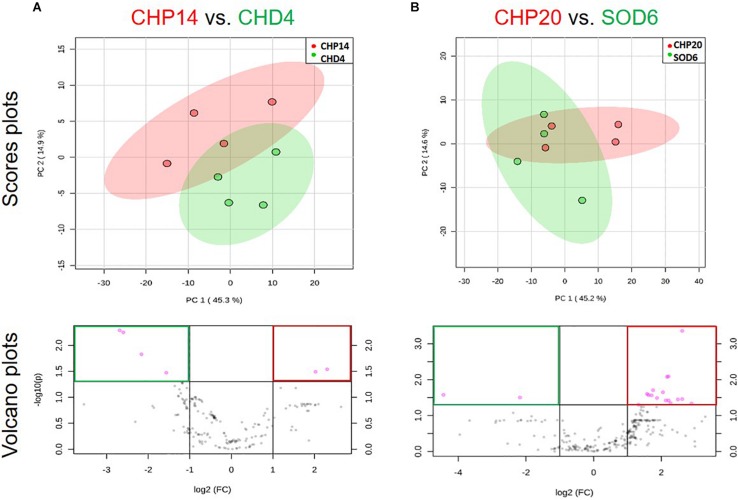
FIGURE 9.
Multivariate analysis of volatiles emitted by active vs. closely related non-active strains. Two dual strain comparisons are shown: (A) CHP14 vs. CHD4; (B) CHP20 vs. SOD6. Active strains are shown in red, inactive relatives in green. Principal component analysis (PCA) score plots are shown in the upper row. These PCA plots display data variance over two principle axes, with explanatory percentages shown in brackets. Volcano plots displaying significance over fold-change are shown in the lower row. Mass features varying with high significance (p < 0.05) and fold-change (>2) are displayed in pink and framed red for features associated with active strains vs. green for those associated with inactive strains.

