FIGURE 3.

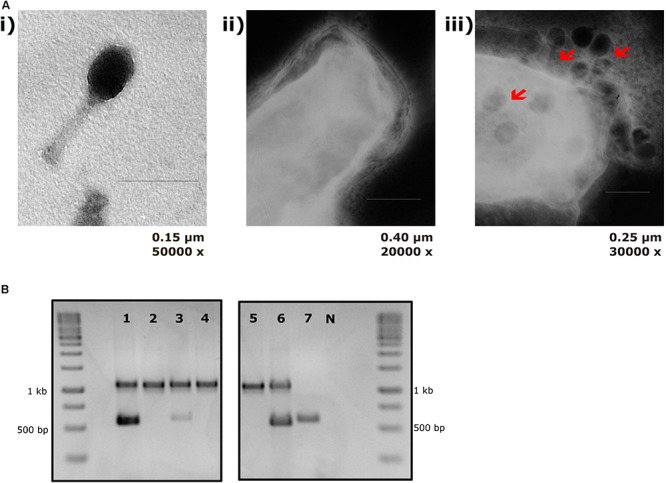
T4 phage attachment to EcN cells: (A) Transmission electron micrograph displaying T4 phages attached to EcN cells: T4 phages were incubated with E. coli (100:1) at 37°C for 2 h and then fixed with 0.5% glutaraldehyde and stained with 0.5% uranyl acetate. Imaging was performed in TEM at different magnifications. Length of the bar is mentioned under each picture. (i) T4 phage incubated with medium (ii) EcN incubated with medium (iii) EcN incubated with T4 phages and the red arrows point out the T4 phages that are attached to EcN cells. (B) Localization of T4 phage DNA in EcN after co-incubation by T4 phage specific PCR: The pellet and the supernatant of EcN incubated with T4 phages for 24 h were used as a template (2 μl/each) in a T4 specific PCR with the primer pair T4_ndd_F and T4_ndd_R (580 bp). Plasmid pKD3 (1 μl) was used as internal standard along with primer pair pKD3_F and pKD3_R (1098 bp). T4 specific PCR was performed with 2× PCR Master Mix (Cat no: K0171, Thermo Fischer Scientific) and PCR conditions are mentioned in the Table 3. Lane details 1: EcN + T4 phage_pellet, 2: EcN + LB medium_pellet, 3: EcN + T4 phage_supernatant, 4: EcN_supernatant + LB medium, 5: LB medium control, 6: LB medium + T4 phage, 7: T4 phage control (no pKD3), N: negative control, M: GeneRuler 1 kb DNA Ladder (Cat no: SM0311, Thermo Scientific). The agarose gel pictures displayed here are cropped image of same gel. The image was cropped and presented using ImageJ 1.50i for clear understanding.
