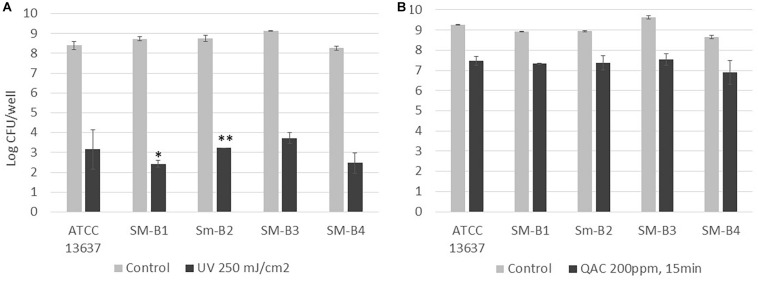
FIGURE 2.
Enumeration of viable cells of S. maltophilia biofilms before and after (A) UV (250 mJ/cm2) and (B) QAC (200 ppm for 15 min) treatment. Each column represents the average of triplicates, and each error bar indicates the standard error. ∗One of the triplicates was below the 1.7 log CFU/well detection limit; ∗∗two of the triplicates were below the 1.7 log CFU/well detection limit.

