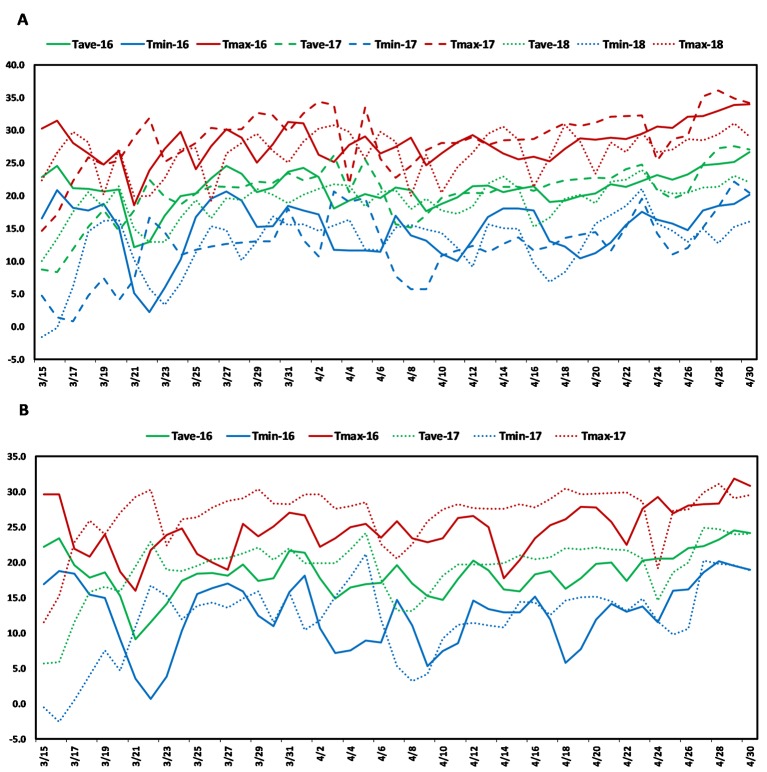
Figure 1.
Weather graph showing daily maximum (red), average (green), and minimum (blue) temperatures during grain filling period in (A) Citra, FL and (B) Quincy, FL. Soft Wheat association mapping panel (SWAMP) was planted three seasons in Citra (2015/2016, 2016/2017, 2017, 2018) and two seasons in Quincy (2015/2016, 2016/2017).

