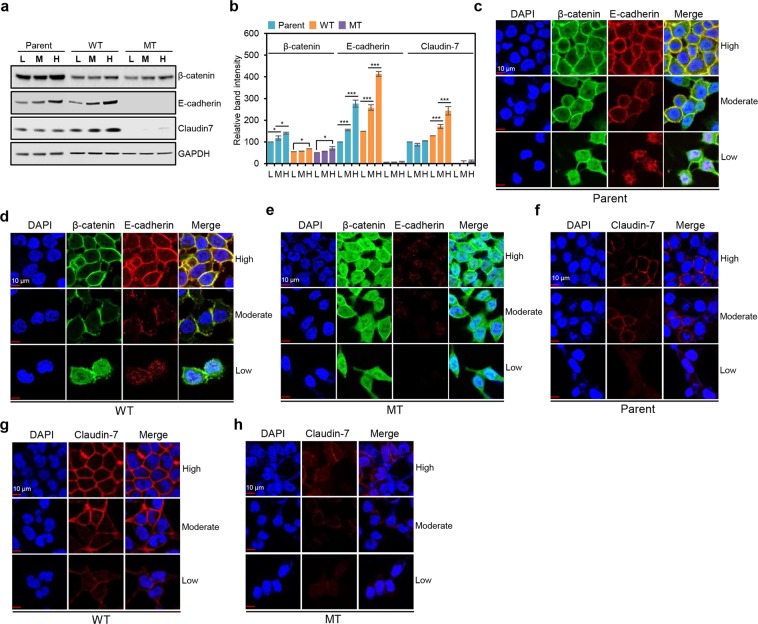
Figure 3.
HCT116-P and HCT116-MT cells show dysregulation of cell-cell adhesion-related proteins. (a) Western blot analysis of β-catenin, Claudin-7, and E-cadherin levels in three HCT116 cell lines (Parent, WT, and MT). (b) Quantification of band intensities for the western blot shown in. (a) Error bars represent the SD of mean band intensities obtained from three independent experiments. One-way ANOVA with a post-hoc test (Bonferroni) was performed to compare multiple means; *P < 0.01, **P < 0.001, ***P < 0.0001. Statistical significance between low (L) and moderate (M) cell densities, and M and high (H) cell densities was shown. Statistical significance between L and H was shown when there was no statistical significance between L and M or M and H. Immunofluorescence microscopy analysis of β-catenin (stained in green) and E-cadherin (stained in red) in (c) HCT116-P, (d) HCT116-WT, and (e) HCT116-MT cells, under conditions of low, moderate, and high cell density. Immunofluorescence microscopy analysis of Claudin-7 (stained in red) in (f) HCT116-P, (g) HCT116-WT, and (h) HCT116-MT, under conditions of low, moderate, and high cell density. Nuclear DAPI staining is shown in blue. All assays were carried out in triplicate.

