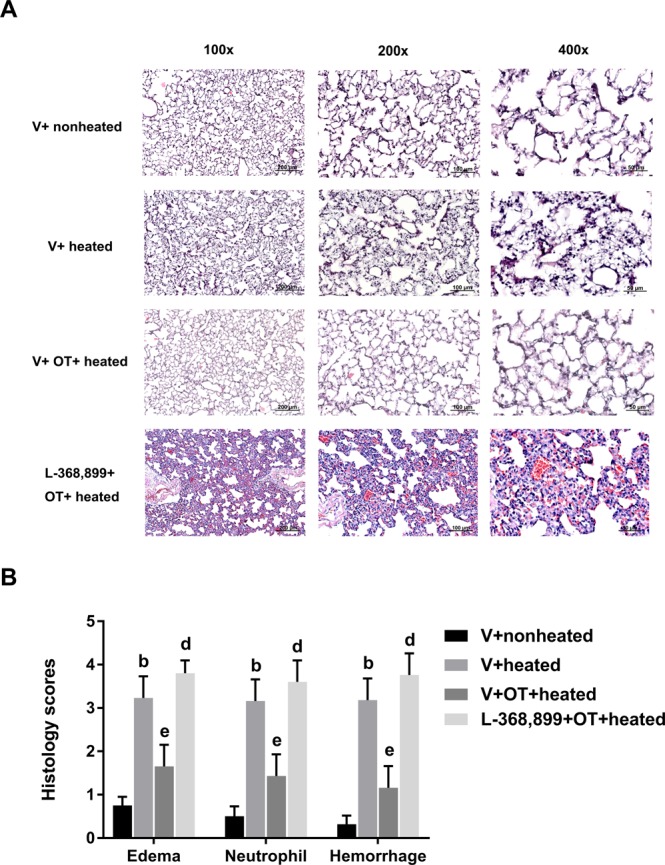
Figure 3.

Lung edema, neutrophil infiltration and hemorrhagic scores in different groups of rats. (A) Representative microscopic images of the lungs from rats in the V + nonheated, V + heated, V + OT + heated and L-368,899 + OT + heated groups. (B) Data are presented as the mean ± SD (n = 10). bP < 0.05, V + heated group vs. V + nonheated group; eP < 0.05, V + OT + heated group vs. V + heated group; dP < 0.05 compared to the L-368,899 + OT + heated group.
