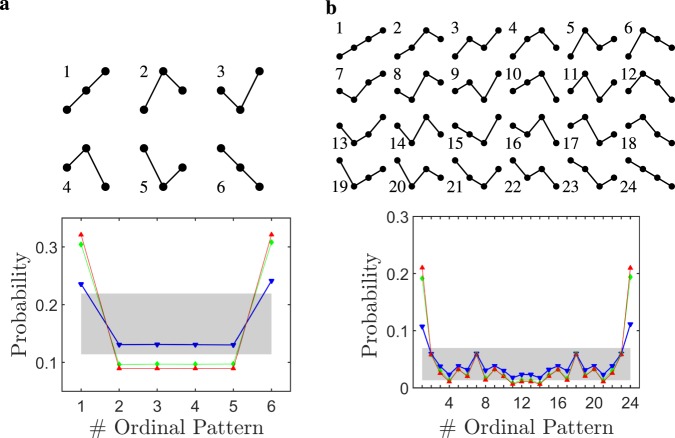
Figure 4.
Ordinal Pattern (OP) probability distributions during wakefulness and sleep. The OP probability distributions shown in the bottom panels correspond to the rat population and electrode location average distributions for each sleep-wake state: Wakefulness (blue), NREM (green) and REM sleep (red). The grey areas show the null hypothesis region with a confidence, which correspond to the uniform OP distribution with twice the standard error of the mean (i.e., ). Panel a [Panel b] shows the possible OPs for embedding dimension [].

