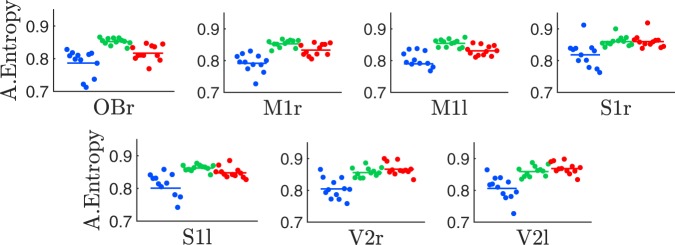
Figure 5.
Amplitude entropy during wakefulness and sleep. From left to right and top to bottom, the panels show the entropy values calculated from the electro-corticographic (ECoG) histograms coming from the different cortical locations shown in Fig. 1; i.e., olfactory bulb, right and left motorsensory, somatosensory, and visual cortices, respectively. The colour code signals the sleep-wake cycle states (W, blue; NREM, green and REM sleep, red) and the symbols and horizontal lines represent the same as in Fig. 1c. The entropy values were calculated from the ECoG amplitude histograms using bins. The sampling rate was . The statistic is shown in the Supplementary Material (see Table S2).

