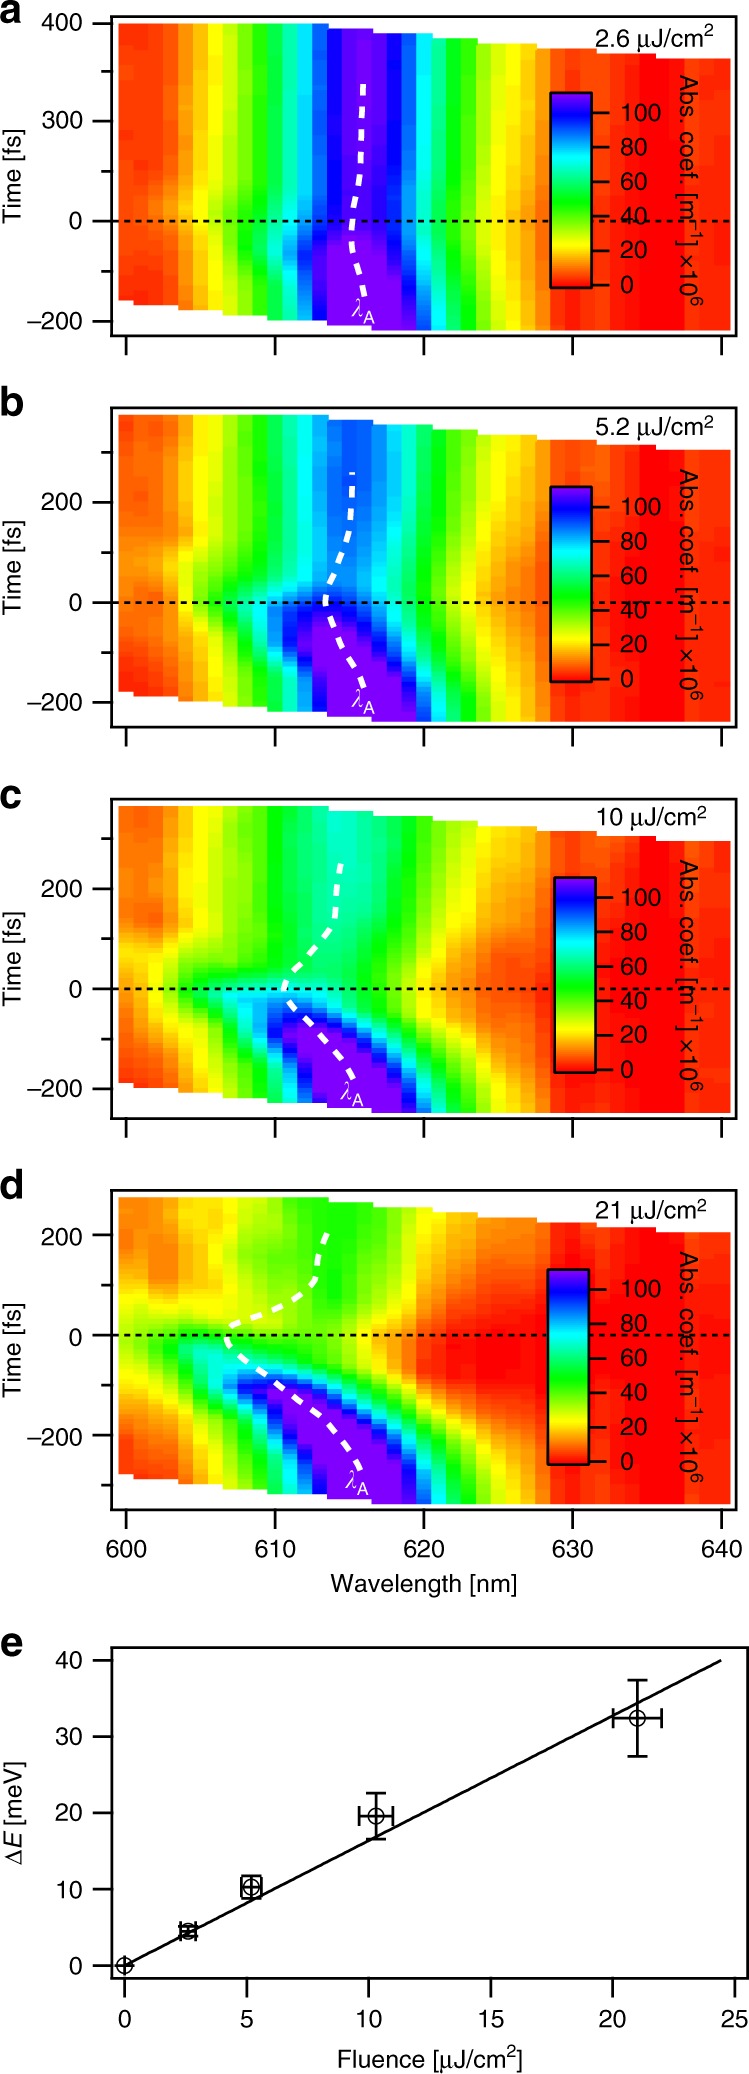
Fig. 5.

Power dependence of the optical Stark effect. Time-dependent absorption spectra of monolayer WS2 recorded for cocircularly polarized 610 nm pump pulses with incident fluences of a 2.6, b 5.2, c 10, and d 21 µJ/cm2. The center wavelength of the A-exciton resonance (λA) is indicated with a dashed white line. Time zero indicates when the pump and probe pulse are temporally overlapped. e Shows the fluence dependence of the maximum optical Stark shift, ∆E. The error bars in fluence represent the propagated uncertainty in pump power and beam diameter. The error bars in ∆E represent the sum of uncertainties in center wavelength of the unperturbed A-exciton absorption and of the absorption at time zero. The solid line is a fit to Eq. (6) for 150 fs pulses, Mgx = 5.2 ± 0.4 D, Eb = 320 ± 40 meV, and a detuning of −23 meV.
