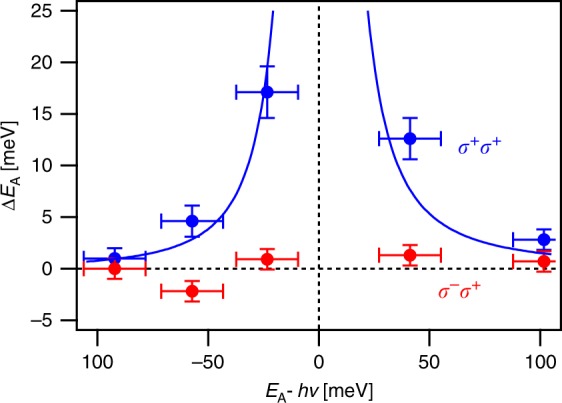
Fig. 6.

Optical Stark effect near A-exciton resonance in monolayer WS2. The maximum photo-induced shift of the A-exciton energy recorded for co- (blue) and cross-circularly polarized (red) pulses as a function of pump photon energy detuning. The pump power was kept constant throughout. The error bars in detuning represent the sum of the estimated bandwidth of a 150 fs Gaussian pulse (~12 meV) and uncertainties in the center wavelengths of both the pump pulse and the unperturbed A-exciton absorption. The error bars in ∆E represent the sum of uncertainties in center wavelength of the unperturbed A-exciton absorption and of the absorption at time zero. The solid blue line is a fit to Eq. (6) for 150 fs 10 µJ/cm2 pulses, Eb = 320 meV, and Mgx = 6.1 ± 0.7 D.
