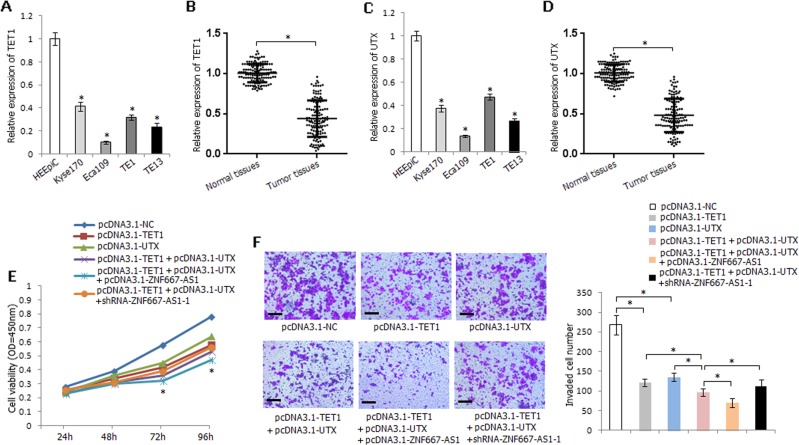
Fig. 8. Expression level and functional analyses of TET1 and UTX in ESCC.
a Relative expression level of TET1 in HEEpiC and four esophageal cancer cell lines. b Relative expression level of TET1 in ESCC tissues and corresponding normal tissues. c Relative expression level of UTX in HEEpiC and four esophageal cancer cell lines. d Relative expression level of UTX in ESCC tissues and corresponding normal tissues. e The influence of TET1, UTX, and ZNF667-AS1 on Eca109 cells viability. *P < 0.05, pcDNA3.1-TET1 or pcDNA3.1-UTX compared with pcDNA3.1-NC; pcDNA3.1-TET1 + pcDNA3.1-UTX compared with pcDNA3.1-TET1 or pcDNA3.1-UTX; pcDNA3.1-TET1 + pcDNA3.1-UTX + pcDNA3.1-ZNF667-AS1 compared with pcDNA3.1-TET1 or pcDNA3.1-UTX or pcDNA3.1-TET1 + pcDNA3.1-UTX; pcDNA3.1-TET1 + pcDNA3.1-UTX + shRNA-ZNF667-AS1-1 compared with pcDNA3.1-TET1 + pcDNA3.1-UTX + pcDNA3.1-ZNF667-AS1. f The influence of TET1, UTX, and ZNF667-AS1 on Eca109 cells invasive ability. The experiments are representative of three independent experiments with similar results. *P < 0.05.

