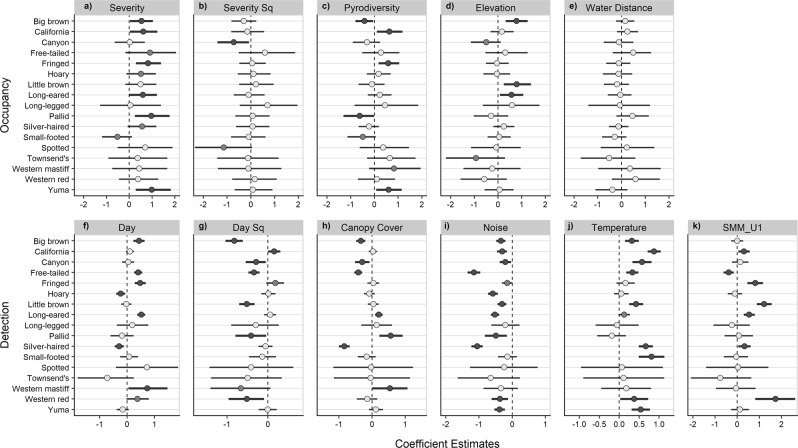
Figure 3.
Dot plots of standardized coefficient estimates for occupancy and detectability. Points represent mean estimates and bars represent 90% credible intervals. Estimates where the probability of a positive or negative effect is greater than 90% and 95% are emphasized by light and dark grey shading, respectively. Full common and scientific names can be found in Table S1. Tabulated coefficient estimates can be found in Table S2.

