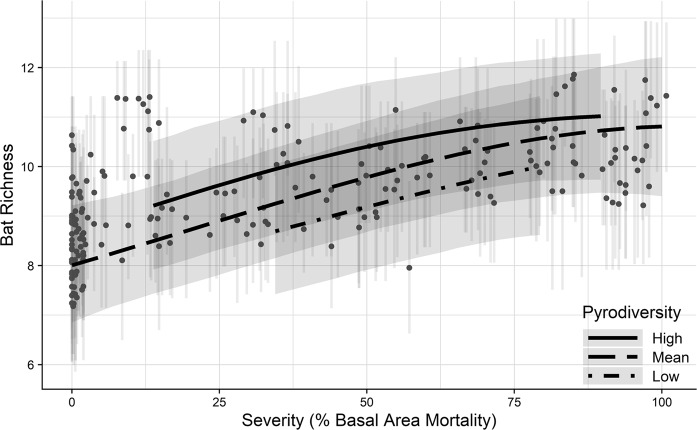
Figure 6.
Model predicted species richness across the full range of burn severity (percent mean basal area mortality). Low, mean and high of pyrodiversity represent −2, 0, and 2 standard deviations from the mean, respectively. Mean predicted richness of each survey period is displayed as points, which are slightly offset using a random “jitter” to display overlapping values. Error bars represent 90% credible intervals. Richness predictions are made using mean severity calculated with a 250 m radius. Because there is little variation in burn severity near extremes (Figure S1), our predictions for high and low pyrodiversity are limited to where sampled pyrodiversity diverged at least 2 standard deviations from the mean.

