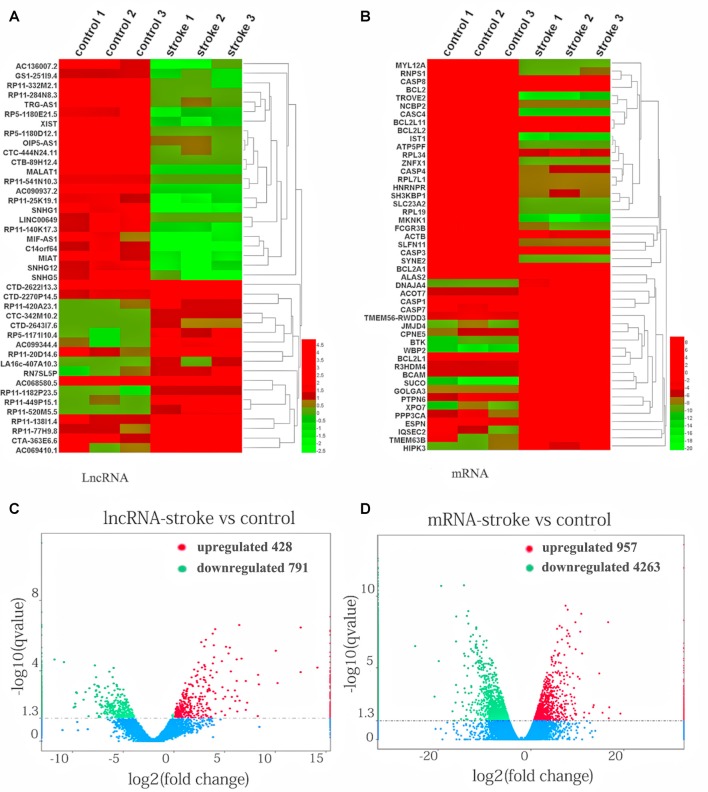
Figure 1.
Aberrantly expressed lncRNAs and mRNAs in patients with acute ischemic stroke (AIS) and healthy controls. Heatmap showing the hierarchical clustering of differentially expressed lncRNAs (A) and mRNAs (B) in AIS patients and healthy controls. Up- and downregulated lncRNAs and mRNAs are represented in red and green, respectively. The volcano plot of lncRNA (C) and mRNA (D) expression signals in AIS patients and healthy controls. Red circles represent upregulated genes, green circles represent downregulated genes, and the dotted line in the volcano plot represents the default significant fold change.

