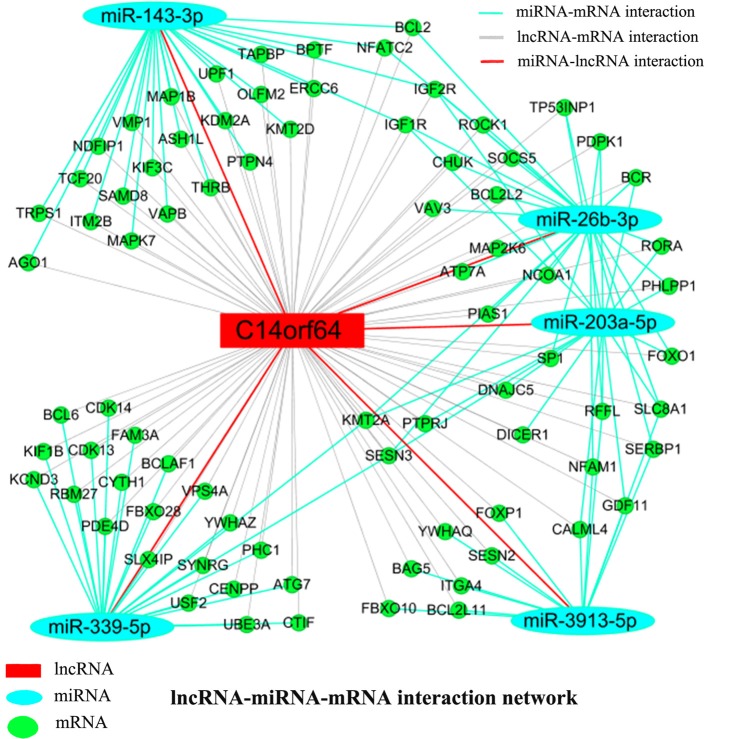
Figure 6.
LncRNA-miRNA-mRNA network. A ceRNA network was constructed corresponding to the miRNA, lncRNA and mRNA variations in AIS patients. Light blue oval nodes represent microRNAs, green circular nodes represent mRNAs, and red rectangular nodes represent lncRNAs. Black edges represent the possible relationship between lncRNAs and mRNAs, light blue edges represent the inhibitory effect of miRNAs on mRNAs, and red edges show the relationship between miRNAs and lncRNAs.

