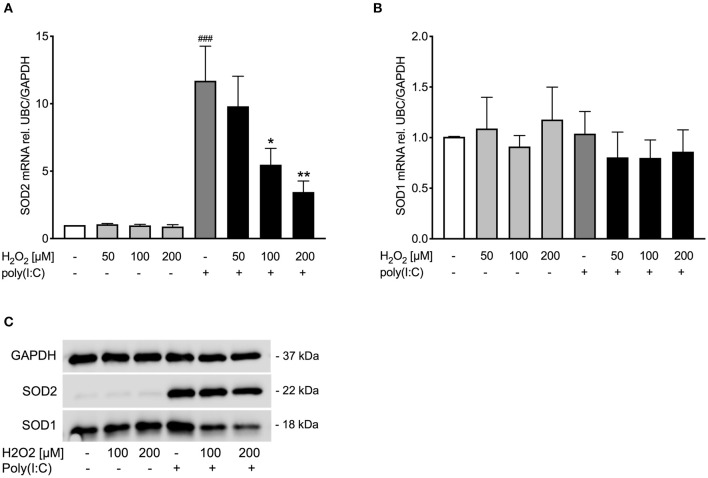
Figure 2.
Poly(I:C)-induced SOD1 and SOD2 expression is reduced upon pre-treatment with H2O2 in asthma bronchial epithelial cells. HBECs from asthma patients were pre-treated with H2O2 for 30 min followed by stimulation with poly(I:C). Cells were harvested for gene and protein expression analysis after 3 and 24 h, respectively. Gene expression levels of SOD2 (A) and SOD1 (B) were measured by real-time PCR and data is presented as mean ± standard error of the mean (SEM) fold change of unstimulated control relative to UBC/GAPDH expression. Comparison of different groups was performed by Kruskal-Wallis with Wilcoxon post-testing. ###p < 0.001 vs. un-stimulated control (CTRL); *p < 0.05, **p < 0.01 vs. poly(I:C). Data was obtained from 7 donors. A representative western blot image (data from 2 donors) of SOD2 and SOD1 (C) protein is shown.

