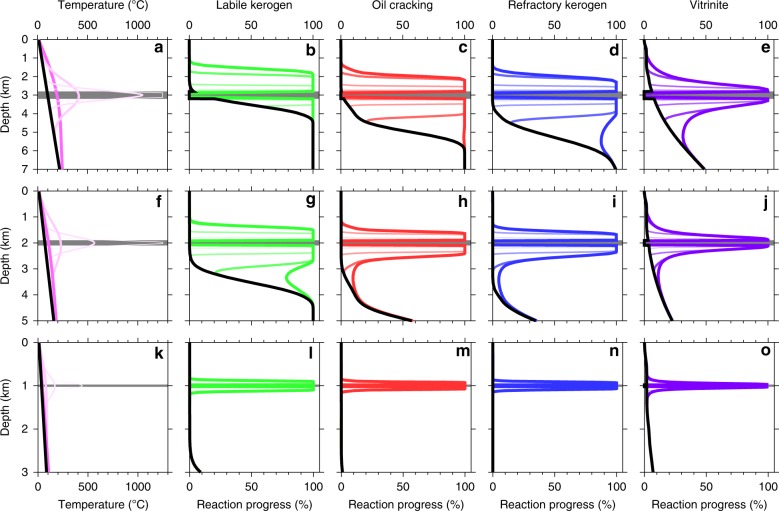
Fig. 2.
Modelling hydrocarbon-generating reactions within thermal aureoles of igneous sills. a–e 400-m-thick sill emplaced at 3 km; f–j 200-m-thick sill emplaced at 2 km; k–n 50-m-thick sill emplaced at 1 km. a, f, k Temperature profiles immediately before sill intrusion (thick black line) and at times after sill intrusion of 100 years (thinnest line, lightest colour), 1000 years, 10,000 years and 100,000 years (thickest line, strongest colour). All other plots show the same time snapshots using corresponding line thicknesses and colour strengths. b, d, l Reaction progress for labile kerogen maturing to oil. c, h, m Reaction progress for oil cracking to methane. d, i, n Reaction progress for refractory kerogen maturing to methane. e, j, o Reaction progress for vitrinite reflectance. The full suite of calculations was done for sill thicknesses of 50, 100, 200, 300 and 400 m at emplacement depths of 0.5, 1.0, 1.5, 2.0, 2.5, 3.0 and 3.5 km.

