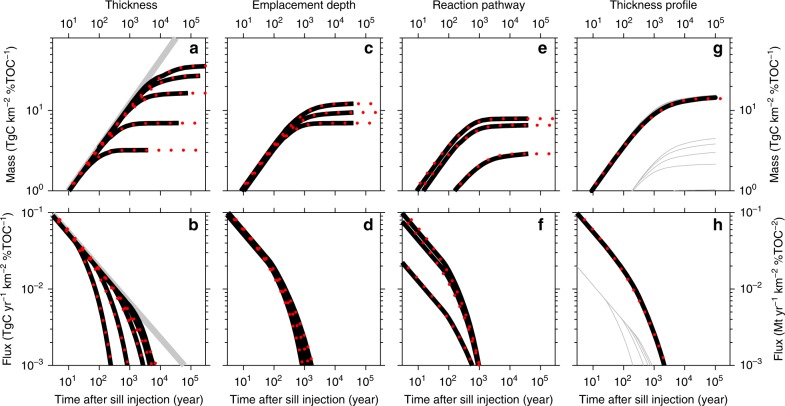
Fig. 3.
Comparison between full carbon emissions modelling results and new carbon emissions parameterisation. Thick black lines represent full thermal and reaction kinetic modelling results; red dotted lines represent new parameterisation. a, b Mass and flux of carbon emissions from breakdown of labile kerogen for sills of thickness 50, 100, 200, 300 and 400 m, all intruded at 1 km depth. Thick grey line shows a power law with exponent p = 0.54 for reference; all calculations in this figure assume a constant host-rock density of 2100 kg m−3, appropriate for the mean emplacement depth (1.2 km), in order to illustrate the consistent tapered power-law behaviour of emissions. c, d Mass and flux of emissions from breakdown of labile kerogen for sills intruded 1, 2 and 3 km deep, all 100 m thick. e, f Mass and flux of emissions for a 100-m-thick sill intruded 2 km deep from three reaction pathways: breakdown of refractory kerogen; breakdown of labile kerogen to oil and then cracking of oil to gas; and direct from labile kerogen. g, h Modelling of emissions for a sill of variable thickness profile. A radially symmetrical sill with maximum thickness 200 m and intruded 2 km deep is divided into five annuli of equal surface area. The thickness of each annulus is prescribed by the radial thickness profile parameterisation in Fig. 2. Emissions from these five annuli (thin grey lines) are summed to estimate the total (thick black lines).

