Fig. 4.
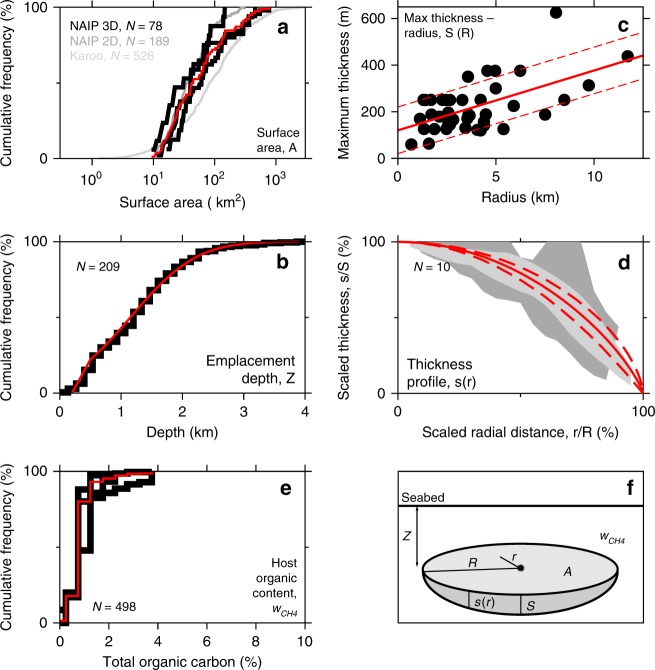
Sill dimension observations used for stochastic modelling. On all panels, black lines and grey areas show observations, red lines show distributions used in stochastic modelling. a Cumulative distribution of sill surface area. Black lines show observations from three 3D surveys close to the centre of the NAIP, and therefore most likely responsible for peak emissions: Faroe-Shetland Basin (excluding Judd sub-basin), Judd basin and NE Rockall basin. Dark-grey line shows observations from 2D survey compilation from Rockall Basin. Light-grey line shows observations from satellite imaging of Karoo sills (for reference; excluded from definition of red line used for stochastic modelling here). b Cumulative distribution of sill emplacement depth, measured from sills imaged on 2D and 3D seismic data across the NAIP basins and around the world. c Maximum thickness versus diameter for sills for which clear reflections from both top and bottom of the sill are observed on seismic data. d Profiles of scaled sill thickness versus scaled radial distance. Grey envelopes represent mean ± 1 standard deviation of the stacked scaled profiles: dark grey shows sill thickness measured directly; light grey shows sill thickness inferred from forced folds. e Host-rock total organic carbon (TOC) content from 498 samples from the Vøring Basin33. The three black lines are the distributions for Paleocene, Upper Cretaceous and Lower Cretaceous rocks. f Definition of sill measurement terms. See Supplementary Fig. 2 for an example of how sills are observed and measured on seismic reflection data.

