Fig. 6.
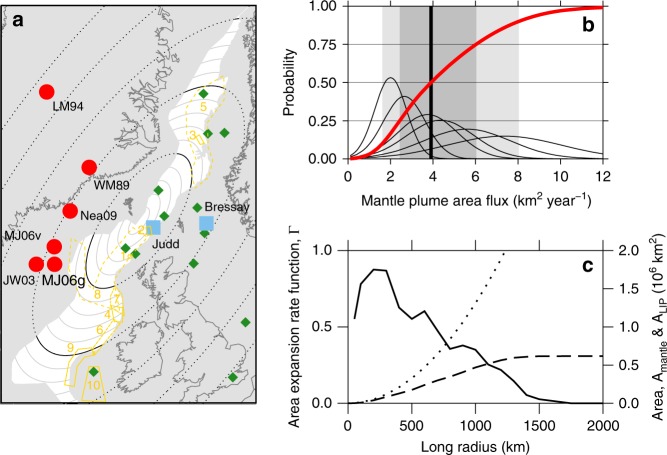
NAIP geography and plume flux data. a Data locations. Blue squares show locations of stratigraphic successions and river profiles used to constrain plume flux36–38,43. Red circles show plume centre locations (references in Table 1). Yellow polygons show seismic datasets used to measure sill area density, ρ (key to numbers in Table 2). Ellipses mark edge of the model plume head used for Figs. 7 and 8 at long radii R in increments of 100 km. Green diamonds show locations of dynamic support measurements from stratigraphic sections used to constrain plume head model18,21,44. b Mantle plume area flux data. Thin black lines show probability density functions associated with the plume flux estimates in Table 1, assuming normal distributions with the standard deviations set to one-quarter of the uncertainty ranges. Red line: corresponding cumulative probability function. Thick black line marks median area flux; darker grey box shows inter-quartile range of area flux; lighter grey box shows 10–90% confidence interval for plume area flux. c Measurement of NAIP sill province area expansion. Amantle (dotted) is the total area inside an ellipse in a. ALIP (dashed) is the area of the NAIP sill province (coloured white) within the ellipse. Γ (solid) is the areal expansion rate function.

