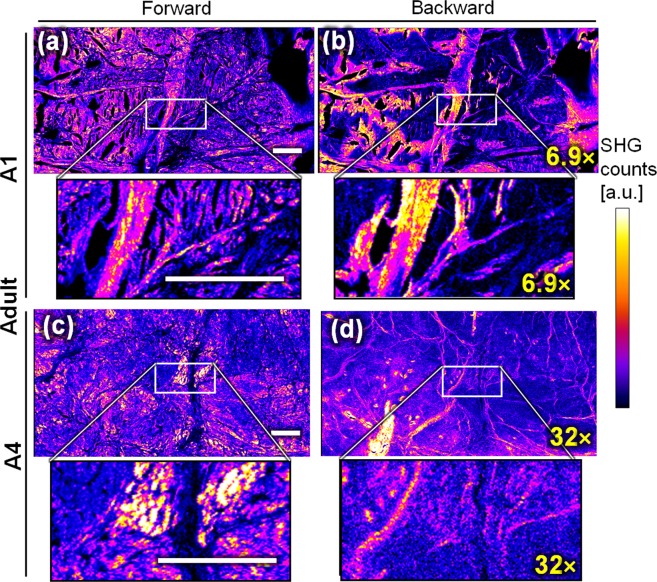
Figure 2.
Forward SHG (left, (a,c)) and backward SHG (right, (b,d)) from two menisci of equine adults (A1 for (a,b) and A4 for (c,d)) knee joints. Both menisci show different patterns in forward and backward directions: the backward images better highlights the thick structures, mostly identified as fibers. The images of the same samples (a,b or c,d) are displayed using the same look-up table, but the backward images have been multiplied by a factor indicated in yellow because less signal is physically detected in this direction compared to forward. Scale-bars: 200 μm.

