Figure 5.
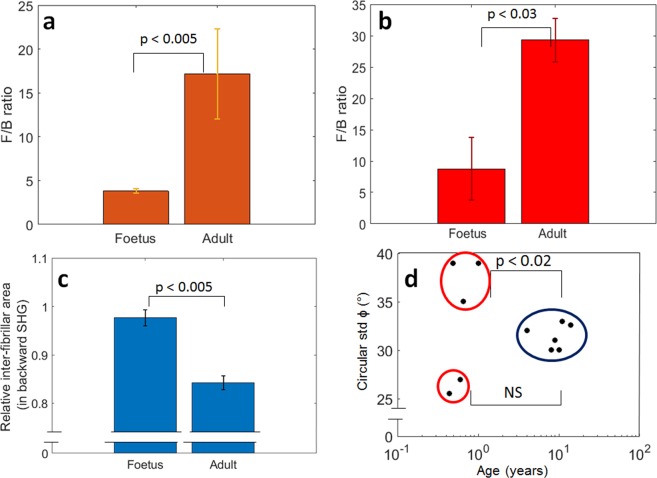
Quantitative results of F/B and P-SHG. Forward over backward ratio (F/B) over the whole image (a) or for the inter-fibrillar area (b) for all the foetus and adult menisci. (c) Relative inter-fibrillar area measured in backward SHG, i.e. the percentage of inter-fibrillar area compared to the whole image. (d) Circular standard deviation (std) of the P-SHG fibril orientation in the image plane (ϕ): the adult (in dark blue) have values around 32°, whereas the foetuses (in red) split in two groups: one having a value of ϕ circular std rather low (~26°), the other one a larger value (~37°). In each graph, the mean of the different values was taken, and the error bars indicate the standard error of the mean (SEM) of the serie. The statistical significance (NS: non-significant, p < 0.05: significant) was tested using the non-parametric Wilcoxon-Mann-Whitney test. The set of samples consist of n = 5 for foetuses and n = 6 for adults, which gives an acceptable statistical representation given the difficulty to obtain foetus samples.

