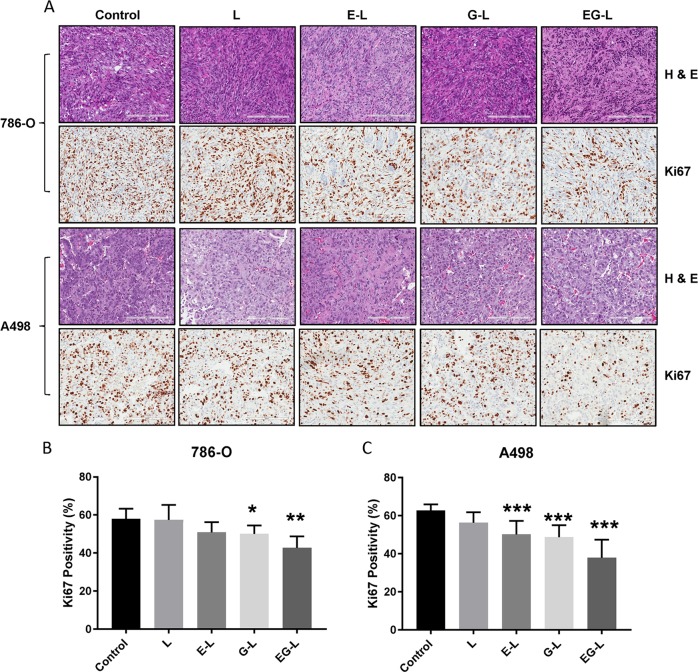
Fig. 3.
H&E and Ki67 staining of tumor sections obtained from the single mouse trial. a Representative images of the H&E and Ki67 stained tumor sections from different treatment groups displayed comparatively higher antiproliferative activity of EG-L. Bar length = 200 µm. b, c Quantification of Ki67-positive nuclei in 786-O and A498 tumor sections, respectively. Error bars in all graphical plots are given based on standard deviation. *, ** and *** denote p < 0.05, p < 0.01, and p < 0.001 compared to control, respectively (n = 5 spatially different regions from same tumor section).

