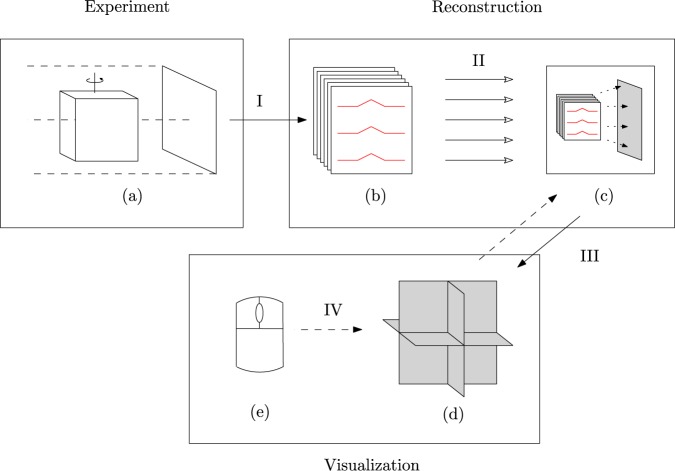
Figure 2.
A tomographic measurement (a) leads (I) to a stack of projection images (b). The rows of these images have to be filtered (in red), which can be done in parallel (II). The filtered projection images can be used to reconstruct individual slices (in grey), by local backprojection operations (c). These slices can be shown together (d). The visualisation software can request reconstructions (III), in particular upon interactive slice rotation and translation (IV) by the user (e).

