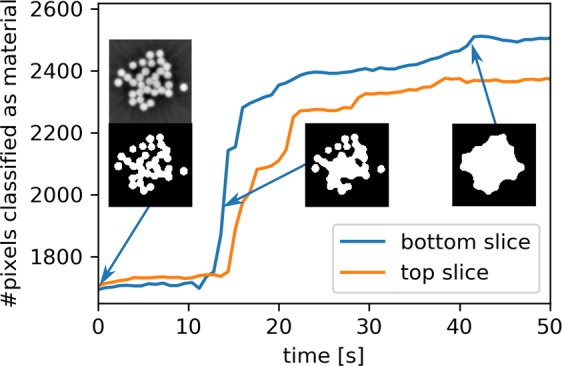
Figure 6.

Quantification of the water uptake in the bottom and top slice as a function of time. The reconstructed slices are segmented using a constant threshold and the total number of pixels classified as material is plotted. The insets show the segmented bottom slices at different time points (along with the reconstructed grey-level image for the first time point which was used to automatically determine the threshold for the segmentation).
