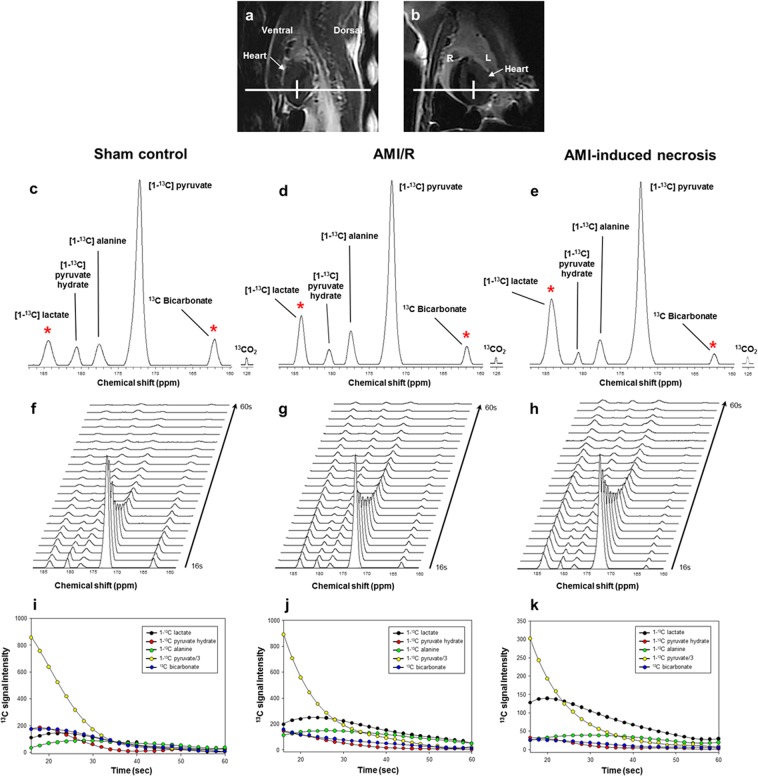
Figure 2.
Dynamic 13C MR spectra of the heart (a: sagittal image; b: coronal image), which were acquired from sham-operated control rat (left), rat with AMI/R (middle), and rat with AMI-induced necrosis (right). Sum spectra (c–e) were reconstructed from the stack spectra (f–h) covering the 16- to 60-second time span. Signal intensity curves (i–k) demonstrate the time course of conversion of [1-13C] lactate, [1-13C] pyruvate-hydrate, [1-13C] alanine, [1-13C] pyruvate, and 13C bicarbonate. *Indicates the significantly different metabolite ratios between the groups (P < 0.05).

