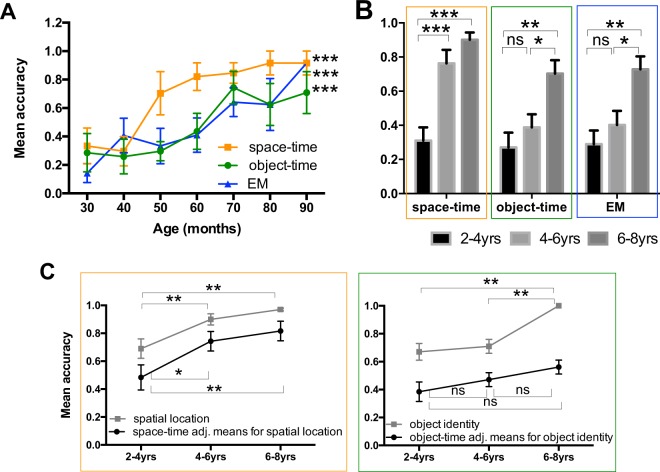
Figure 2.
Early emergence of space-time binding across TD. (A) The graph presents the proportion of accurate responses across 2 to 8 years of age for space-time, object-time, EM. Space-time binding emerges first, followed by the other two conditions. Significant correlations were found between age as continuous variables and the three measures. (B) The graphs present the accuracy means for Space-Time, Object-Time and EM Tests in the TD sample divided by age-groups (2–4; 4–6; 6–8 yrs). (C) The graphs present the means for spatial location accuracy, and space-time binding adjusted for spatial location accuracy (left), and for object identity accuracy, and object-time binding adjusted for object identity accuracy (right). Adjusted means were calculated using GZLM. ns; p < 0.05 *p < 0.01 **p < 0.001 ***.

