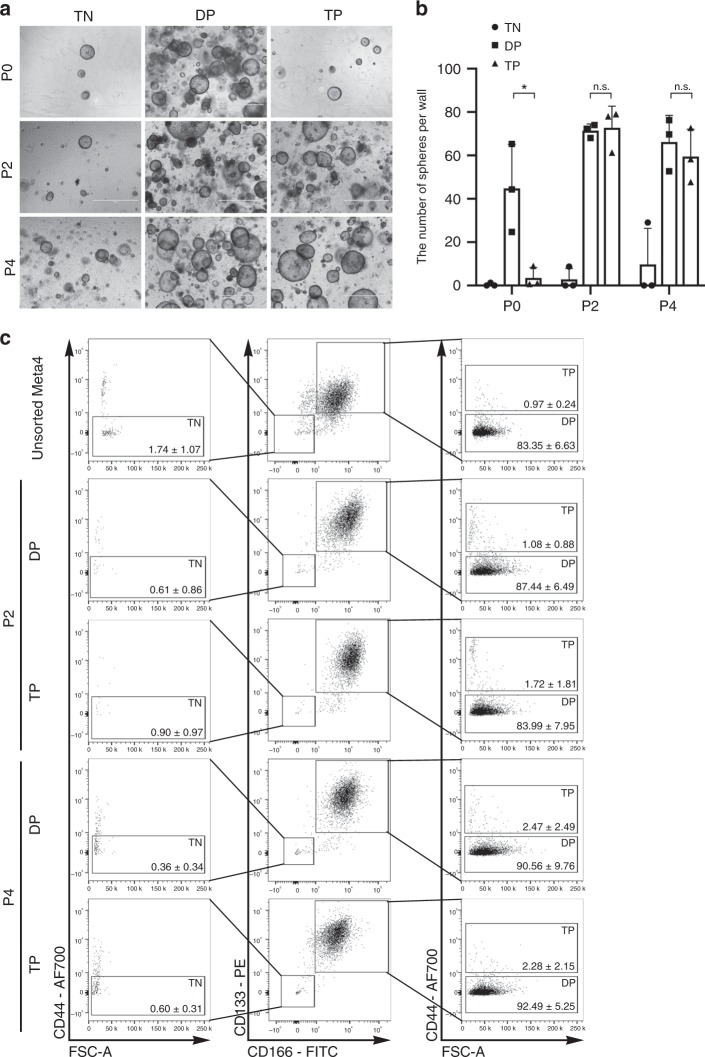
Fig. 9. Expansion of spheres derived from single dysplastic stem cells in Meta4.
a Phase contrast images of spheres derived from isolated Triple-negative (TN), Double-positive (DP) or Triple-positive cells (TP) at passage 0 (P0), 2 (P2) and 4 (P4). Images were captured at about 1 week after plating (P0), at day 5 of P2, at day 5 of P4. TN (CD44neg/CD133neg/CD166neg) cells were isolated as a control population. Scale bars indicate 1000 μm. b Quantitation of the number of spheres formed from the Triple-negative (TN), Double-positive (DP) or Triple-positive (TP) cells at P0, P2, and P4. Data are presented as mean values with standard deviation (n = 3). P-values were calculated using paired two-tailed t-test. *P = 0.048 (DP vs. TP at P0); n.s., not significant. c Representative FACS profiles of the Triple-negative (TN), Double-positive (DP) and Triple-positive (TP) cells analyzed in unsorted Meta4 organoids and spheres derived from isolated DP or TP cells at P2 and P4. CD44 positive gate was used to distinguish DP and TP cells (right graphs) among CD133+/CD166+cells (top right boxes, middle graphs) or to distinguish TN cells (left graphs) from CD133neg/CD166neg cells (bottom left boxes, middle graphs). The percentage of each TN, DP, and TP cells was not significantly different between unsorted Meta4, DP and TP at P2, and DP and TP at P4. Source data are provided as a Source Data file.

