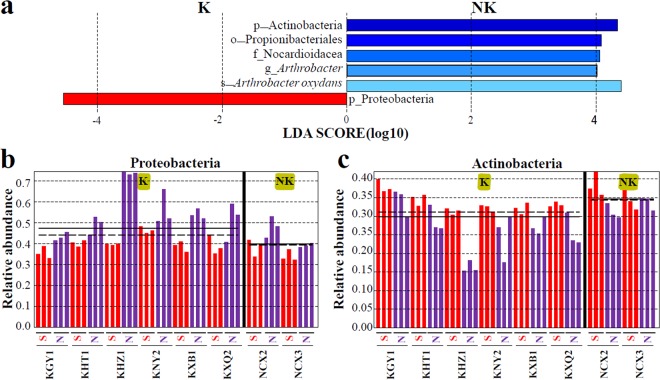
Figure 3.
The significantly different bacteria in different soil samples. (a) linear discriminant analysis (LDA) effect size (LEfSe) analysis identifies phylum (p), class (c), order (o), family (f) genus (g) and species (s), which are significantly different among soil types, logarithmic LDA score ≥ 4.0. Proteobacteria (b) or Actinobacteria (c) biomarker abundance were compared in soil samples. K represents all the samples of rocky desertification areas (karst areas). NK represents all the samples of non-rocky desertification areas (non-karst areas).

