Fig. 3.
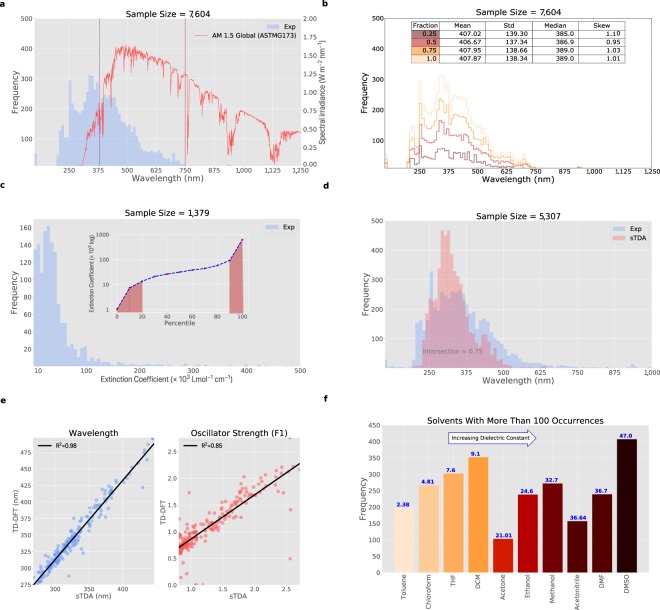
Data validation. (a) Histogram of experimental λmax values for all valid compounds in the dataset6 (blue) overlaid with the AM 1.5 Global Tilt Spectra (red). (b) Histogram for different fractions drawn from the experimental λmax values for all valid compounds in the dataset6. (c) Histogram for experimental extinction coefficients, ϵ, for all valid compounds in the dataset6 (inset: experimental extinction coefficient percentiles with the outliers outlined in red). (d) Histograms for a subset of compounds of their experimental λmax values (blue) and computed first excitation wavelengths (red). (e) Comparison of sTDA computed properties with the corresponding values computed by TD-DFT. (f) Bar chart of the 10 most common solvents used in the experimental measurements of λmax and ϵ values, where there are at least 100 occurrences in the database6; solvents are ordered according to the increasing values of dielectric constants. NB: Units in plots correspond to those found most frequently during our data extraction.

