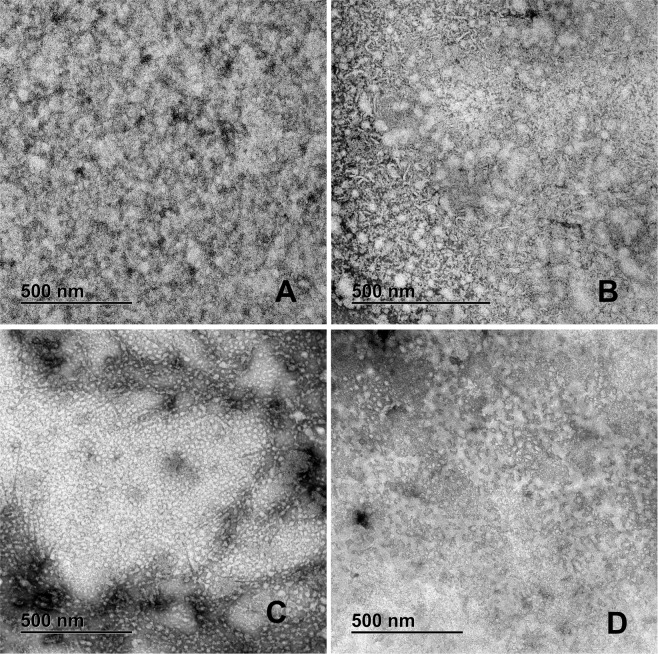
Figure 3.
Representative TEM images of Negative staining of the patient PTS. (A) Group A-T1DM; many oligomers and a few intermixed fibers. (B) Group B-T2DM; We can see large oligomers forming clusters, mixed with small and medium fibers. (C) Group C-Obesity; A high amount of medium oligomers is found with very elongated fibers. (D) Group D-Healthy children; Small and medium oligomers with small fibers. PTS at 0.1 mg/mL were in PBS 1X pH 7.4 before TEM experiments.

