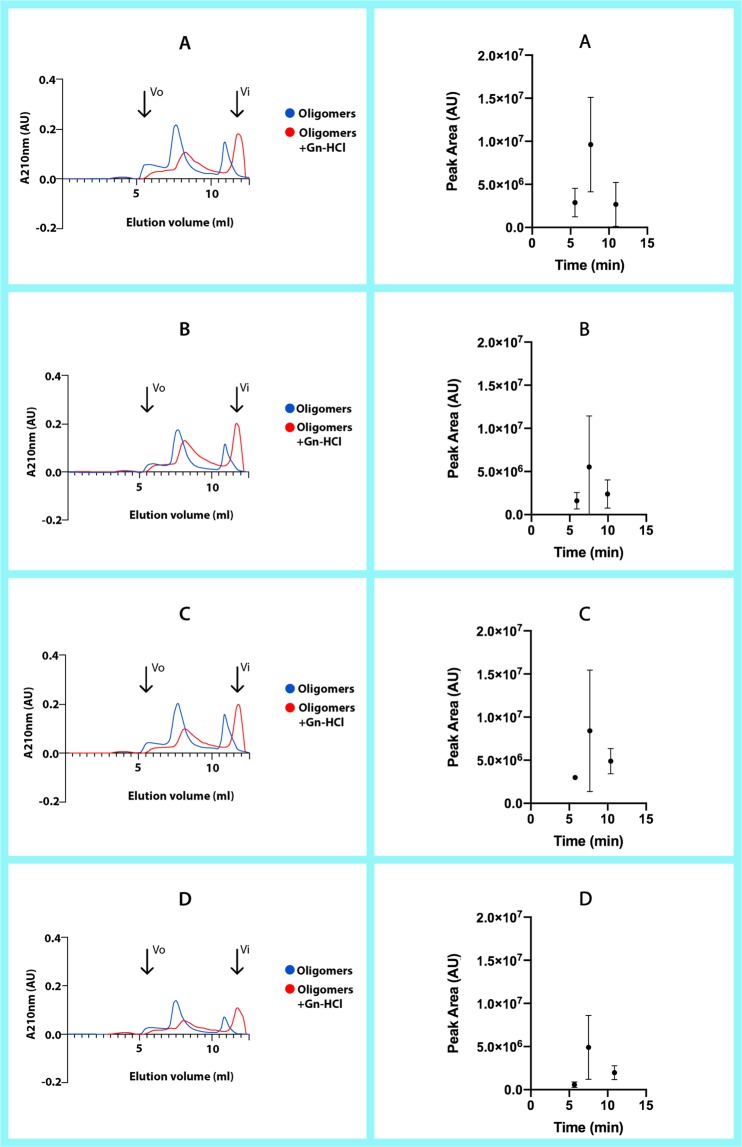
Figure 8.
Results from the SEC fractionation experiments on a BioSuite 250, 5 μm HR SEC column. The panels on the left show the chromatography for selected representative PTS from each group, both with and without Gn-HCl as denaturant. The panels on the right show the results for all the PTS run for each group, where we can compare the differences between each sample’s peak area and elution time (without Gn-HCl). (A) Group A-T1DM, (B) Group B-T2DM, (C) Group C-Obesity, (D) Group D-Healthy children. All measurements were performed with 0.8 mg/mL of patient PTS or 0.4 mg/mL of patient PTS:Gn-HCl (3 M), in 50 mM Tris-HCl + 50 mM KCl pH = 7.4 at flow rate of 1 ml/min.

