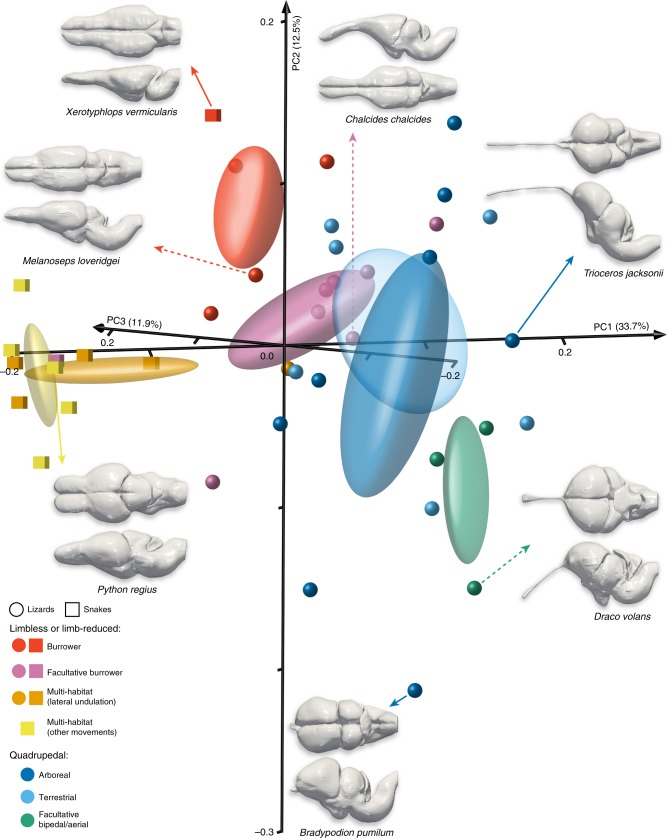
Fig. 3.
Whole-brain shape variation in squamates with different locomotor behaviours. 3D plot of principal component (PC) scores showing the whole-brain shape distribution of snakes (coloured cubes) and lizards (coloured spheres) with different locomotor modes (see colour code and symbols in bottom left corner). Numbers in brackets indicate the percentage of variance explained by each of the PC axes, and 68% confidence ellipses are shown for each locomotor mode. The 3D-rendered whole-brains corresponding to extreme (indicated by coloured solid arrows, with species names) or representative (coloured dashed arrows, with species names) lizard and snake species in both positive and negative directions along the first two PCs are shown in dorsal (top) and lateral (bottom) views. Source data are provided as a Source Data file.

