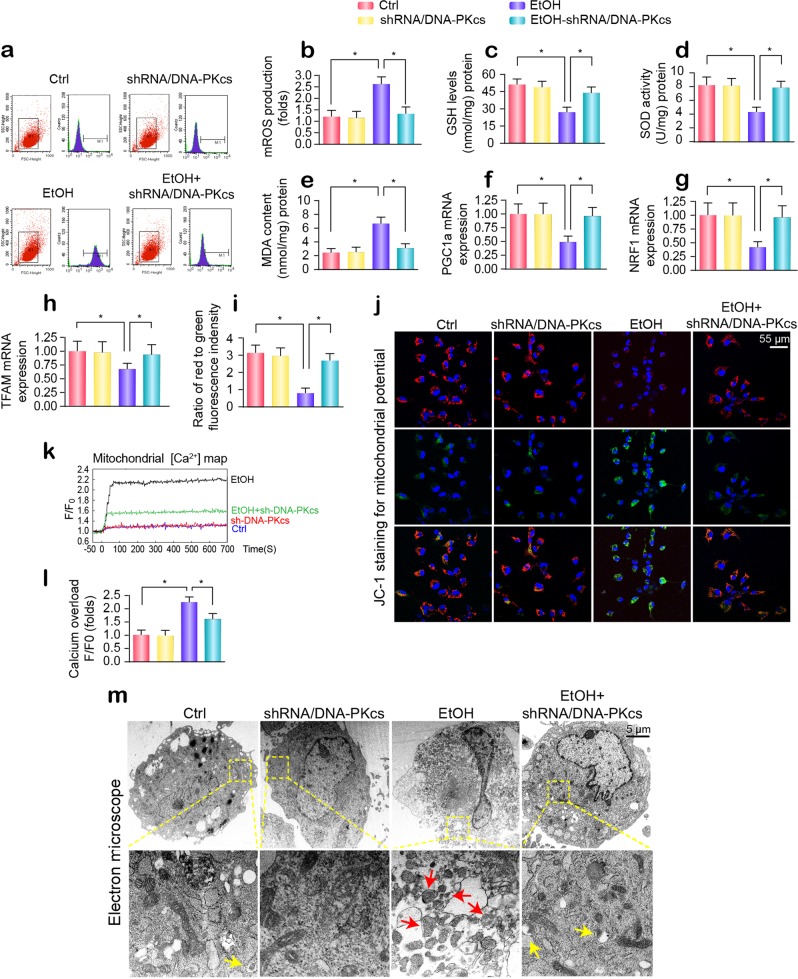
Fig. 3. Alcohol induces liver mitochondrial damage via DNA-PKcs.
a, b Mitochondrial reactive oxygen species content. The chart indicates the quantitative flow cytometry results. c–e Changes in GSH, SOD, and MDA levels, as determined by ELISA. f–h mRNA analysis of PGC-1a, NRF1, TFAM in hepatocytes transfected with shRNA/DNA-PKcs in the presence of ethanol stimulation. i, j The membrane potential was analyzed by JC1 staining. k, l The [Ca2+]m map, as determined by confocal microscopy using Rhod-2. The fluorescence intensity of Rhod-2 was measured at an excitation wavelength of 550 nm and an emission wavelength of 570 nm. The data (F/F0) were obtained by dividing the fluorescence intensity (F) by the fluorescence intensity at the resting level (F0) (t = 0) and were normalized to the control groups. m Representative electron microscopy (EM) images of morphological changes in mitochondria. Red arrows: fragmented or round mitochondria. Yellow arrows: mitochondria contained in lysosomes, indicative of mitophagy. The experiments were repeated three times with similar results. The data represent the mean ± standard error of the mean. *p < 0.05.

