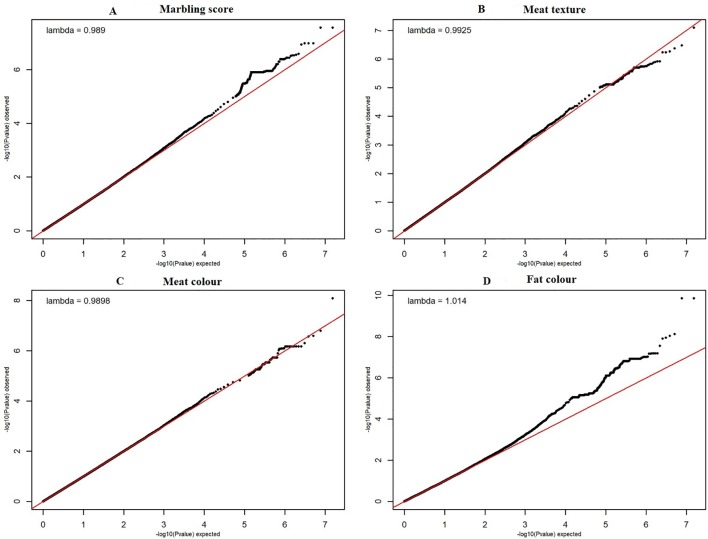
Figure 1.
The quantile-quantile (QQ) plots for the studied meat quality traits. The figure showed quantile–quantile plot for each meat quality traits with genomic inflation control (lambda) value. The red line represents the 95% concentration band under the null hypothesis of no association among traits and SNPs. The black dots represent the P-values of the entire study. The panels (A–D) have shown the QQ plots for marbling score, texture, meat and fat color traits respectively.

