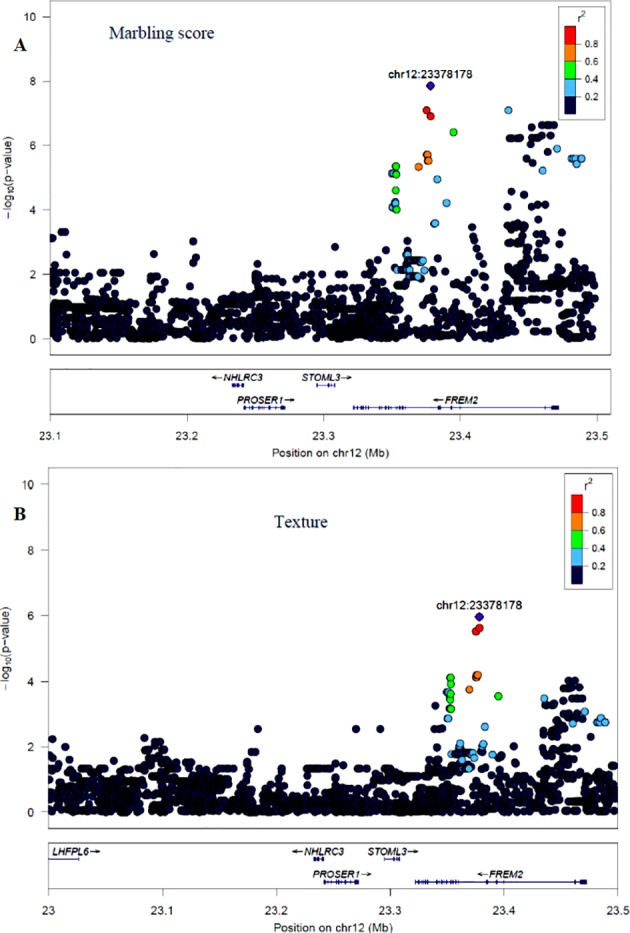
Figure 4.

LocusZoom plots for the top significant SNP that was associated with marbling score (panel, A) and meat texture (panel, B) within 0.5 Mb of a genomic region on BTA12. The bottom panel of a LocusZoom plot shows the name and location of genes in the UCSC Genome Browser. Positions of exons are displayed, and the transcribed strand is indicated with an arrow. Gene names are automatically spaced relative to one another to avoid overlap.
