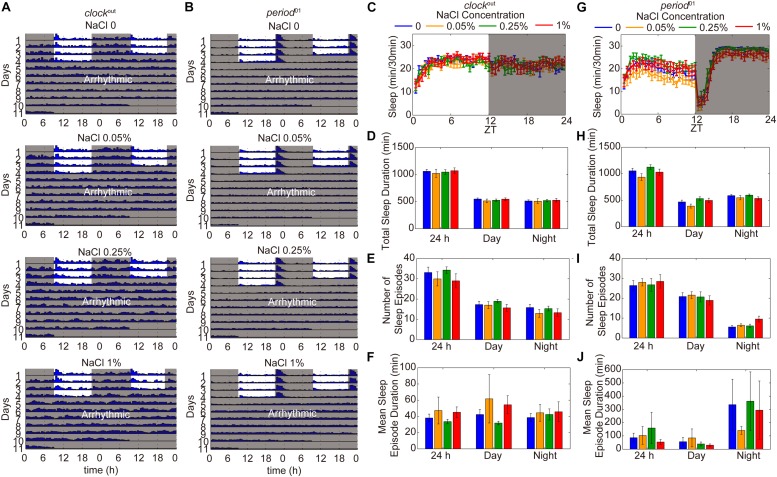
FIGURE 5.
HSD-induced sleep changes are dependent on the circadian rhythm system. (A) Actograms of clockout and period01 mutants fed, from top to bottom, sucrose/agar and diets supplemented with 0.05, 0.25, and 1% NaCl. Locomotor activity was monitored in LD conditions for 4 days and then in DD for 7 days. Within each actogram, two consecutive days of activity are shown in each row; the 2nd day is re-plotted in the left half of the next row down, and thus consecutive days of locomotion can be viewed both horizontally and vertically. The heights of bars within a given actogram row reflect varying amounts of locomotion per 30 min data-collection bin. (B) Actograms of period01 mutants fed, from top to bottom, sucrose/agar diet and diets supplemented with 0.05, 0.25, and 1% NaCl. (C–F) clockout flies (n = 40–50 per group) were fed sucrose/agar diet (blue) or a diet supplemented with 0.05% NaCl (yellow), 0.25% NaCl (green), or 1% NaCl (red) and the following were determined for a 24 h period, daytime, and nighttime: (C) minutes of sleep per 30-minute period, (D) average sleep duration, (E) number of sleep episodes, and (F) mean sleep episode duration. (G–J) period01 flies (n = 45–60 per group) were fed sucrose/agar diet (blue) or a diet supplemented with 0.05% NaCl (yellow), 0.25% NaCl (green), or 1% NaCl (red) and the following were determined: (G) minutes of sleep per 30-minute period, (H) average sleep duration, (I) number of sleep episodes, and (J) mean sleep episode duration. Values plotted are means ± S.D.

