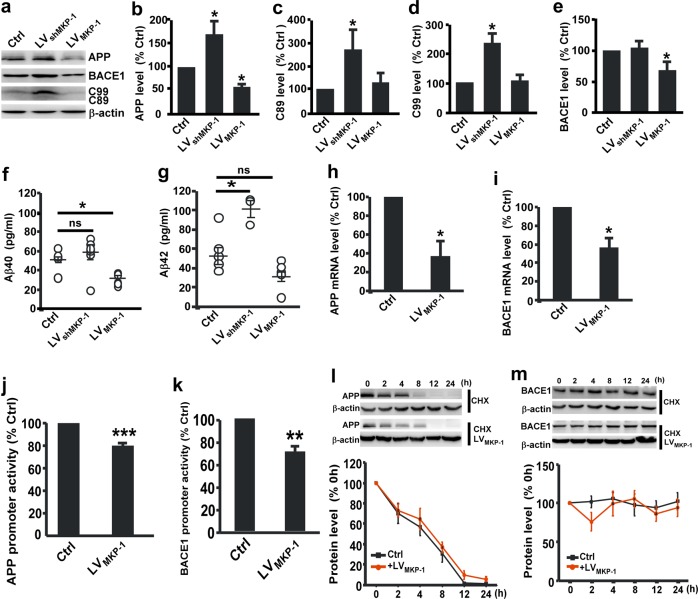
Fig. 3.
MKP-1 reduced APP processing in N2AAPP cells. a–e The protein levels of APP b, C89 c, C99 d, and BACE1 e, assessed by western blot in lysates of N2AAPP cells after overexpression of MKP-1 by LVMKP-1 or knockdown of MKP-1 by LVshMKP-1. *p < 0.05 by one-way ANOVA. n = 5–6 in each group. f, g The generation of Aβ40 f and Aβ42 g as measured by ELISA in the conditioned media of N2AAPP cells after overexpression of MKP-1 by LVMKP-1 or knockdown of MKP-1 by LVshMKP-1. *p < 0.05 by one-way ANOVA. n = 5–6 in each group. h, i The mRNA levels of APP h and BACE1 i as assessed by qPCR in N2AAPP cells after LVMKP-1 transfection. *p = 0.017 for APP and *p = 0.038 for BACE1 by unpaired Student’s t test. n = 3–4 in each group. j, k The promoter activity of APP j and BACE1 k assessed by luciferase assay in cells transfected with LVMKP-1. ***p < 0.001 and **p = 0.004 by unpaired Student’s t test. n = 3–4 in each group. l, m The degradation of APP l and BACE1 m assessed by half-life measurements in LVMKP-1-transfected N2AAPP cells treated with 100 μg/ml cycloheximide (CHX). p = 0.438 for APP and p = 0.483 for BACE1 by two-way ANOVA. n = 4–5 in each group.

