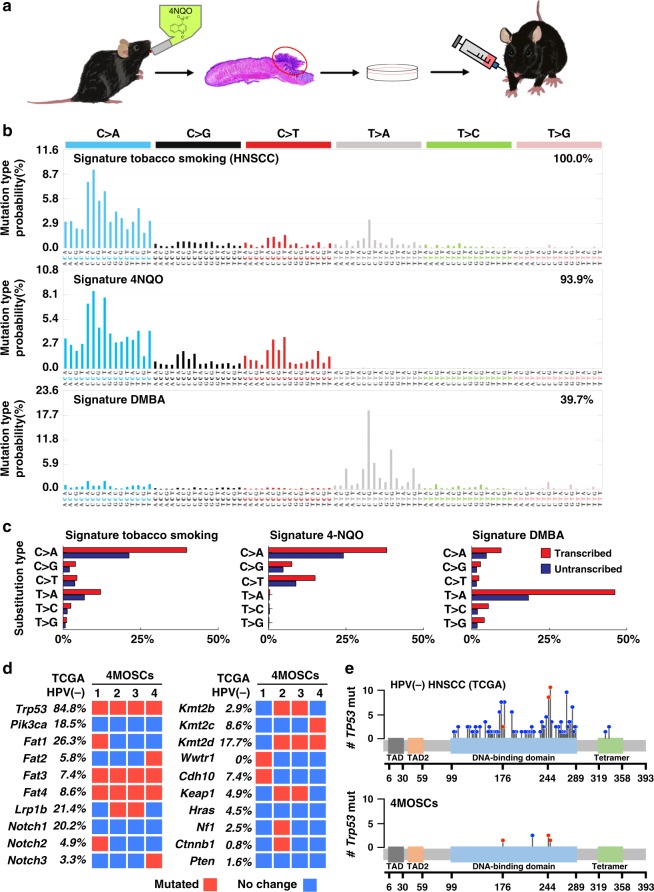
Fig. 1. Development of a novel syngeneic mouse model for oral squamous cell carcinoma.
a Experimental scheme of 4NQO syngeneic model. C57Bl/6 mice were given 4NQO (50 μg/mL) in the drinking water for 16 weeks and then regular water until week 22. Cells were isolated from the lesions, cultured, and then implanted into the tongue of wild-type C57Bl/6 mice. The Scheme was drawn by Yagi and Allevato. b Mutational signatures associated with tobacco smoking. The somatic mutational profiles of the four lesions from mice exposed to 4NQO were correlated to known mutational signatures in human cancer (Pearson correlation > 0.93)19,24. Top, Signature 4 extracted from cancers associated with tobacco smoking, this signature was found only in cancer types in which tobacco smoking increases risk and mainly in those derived from epithelia directly exposed to tobacco smoke19; middle, the pattern of a mutational signature of lesions from mice exposed to 4NQO, compilation of all four samples analyzed; bottom, the pattern of a mutational signature of lesions from mice exposed to DMBA. The similarity between signature tobacco smoking associated HNSCC and signature 4NQO is 93.9%; and the similarity between signature tobacco smoking associated HNSCC and signature DMBA is only 39.7%. c Percentage of somatic substitutions located in translated or untranslated in tobacco smoking associated HNSCC patients (left), 4NQO derived lesions (middle) and DMBA derived lesions (right). d Graphical matrix representation of the individual mutations in four syngeneic cell lines (4MOSCs) isolated from lesions from mice exposed to 4NQO. Listed are the alterations most frequently observed in human HNSCC and the corresponding percentage of mutations. Mutations (red), or no mutations (blue) are listed in rows and four different cell lines are in column. e Mutational plot of TP53 mutations in 243 HPV-negative tumor samples from TCGA (top) and of four syngeneic cell lines (4MOSCs) (bottom). Frequency of mutation is depicted by height of lollipop, blue circles represent mutations unique to human or mouse, and red circles depict mutations in common between human and mouse HNSCCs.

