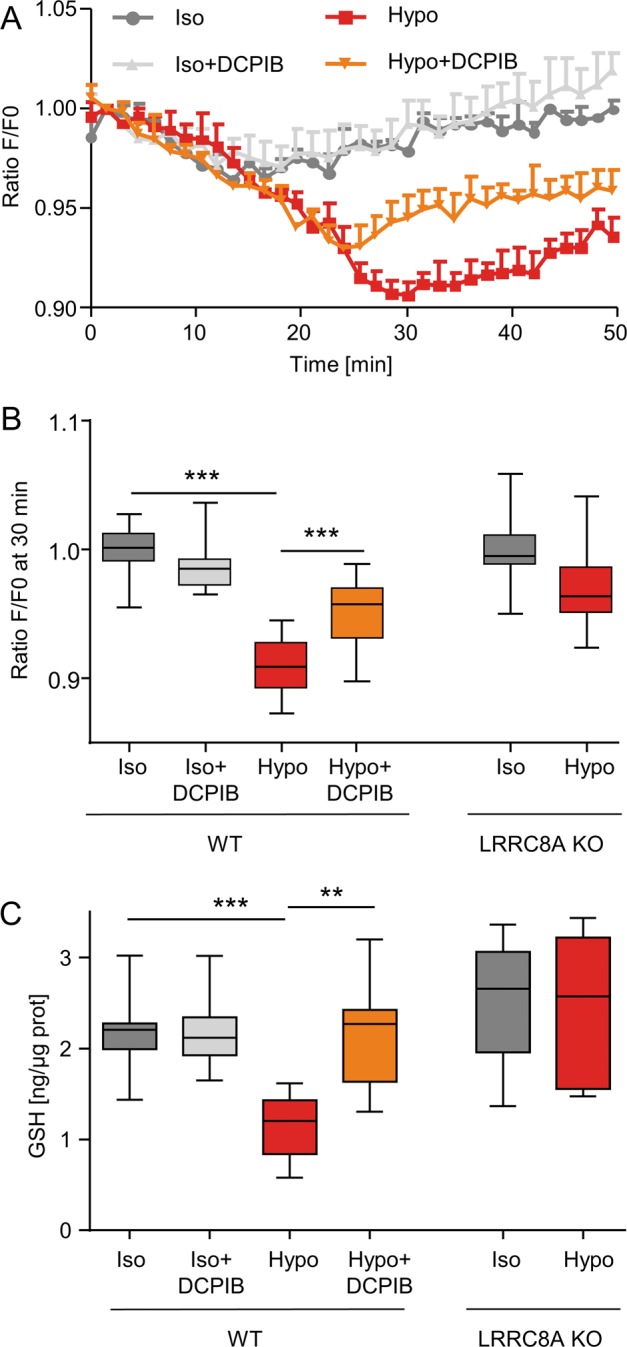
Fig. 1. Variations in GSH intracellular contents in WT and LRRC8A-KO HEK293 cells during hypotonic shock.

a Kinetics of fluorescence variations reflecting the intracellular GSH variations measured in WT HEK293 cells exposed to isotonic (300 mOsm l−1) and hypotonic (100 mOsm l−1) solutions in the absence or presence of DCPIB (20 µM). Cells were loaded for 30 min in the presence of the fluorescent GSH probe (CMFDA). After an equilibrium period of 10 min, fluorescence variations of the confluent monolayers were monitored every 90 s for a total period of 50 min. b Normalized fluorescent variations measured in WT and LRRC8A KO HEK293 cells under iso-osmotic or hypotonic solutions in the absence or presence of DCPIB. Box plots display values taken at a fixed time of 30 min after the beginning of the hypotonic exposure (n = 18 measurements from six independent experiments for WT and n = 11 measurements from four independent experiments for LRRC8A KO HEK293 cells, Kruskal-Wallis with Dunn’s multiple comparison post hoc test, ***p < 0.001). c Effect of hypotonic exposure (30 min, 100 mOsm l−1) on the intracellular GSH content measured in WT and LRRC8-KO HEK293 cells using the fluorescent probe o-phthalaldehyde (OPA). Confluent monolayers were incubated in isotonic (300 mOsm l−1) and hypotonic (100 mOsm l−1) solutions in the absence or presence of DCPIB (20 µM). Box plots represent intracellular GSH content obtained from 12–15 measurements (four independent experiments) for WT HEK293 and nine measurements (three independent experiments) for LRRC8A KO HEK293 cells. Kruskal-Wallis with Dunn’s multiple comparison post hoc test was used with **p < 0.01, ***p < 0.001.
