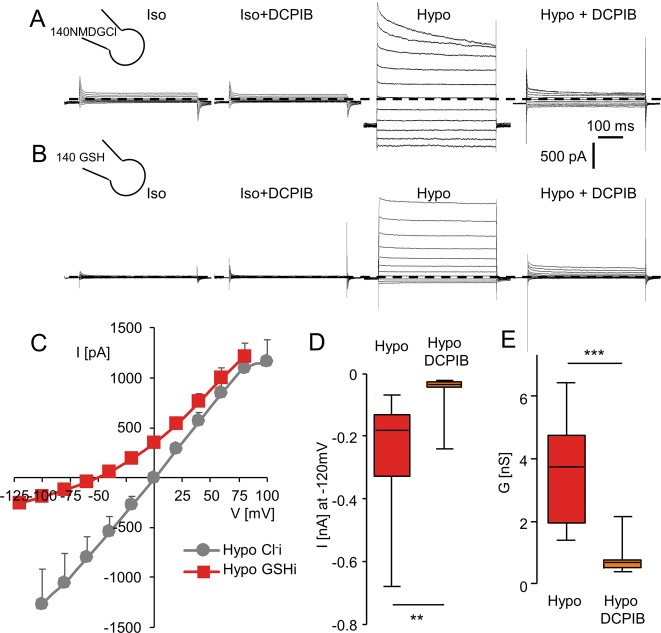
Fig. 3. Chloride and GSH permeabilities of the LRRC8/VRAC conductance measured in HK2 kidney cells.
a Whole-cell Cl− currents recorded in HK2 cells under control conditions (Iso, 340 mOsm l−1), in the presence of DCPIB (10 µM, Iso + DCPIB), after replacing the bath with a hypotonic solution (Hypo, 270 mOsm l−1) and after the addition of DCPIB (10 µM). Normal bath solution and pipette solution (290 mMosm l−1) contained 140 mM of NMDGCl. b Whole cell currents recorded as in (a) after replacement of the NMDGCl pipette solution with an iso-osmotic GSH pipette solution. Bath solution compositions are the same as in (a). c Mean I/V relationships measured in HK2 cells recorded in control conditions (Iso) and in hypotonic condition (Hypo) with chloride or GSH pipette solutions. Current values were measured 6 10 ms after the onset pulse. d, e Box plots illustrating the remaining GSH current (e, measured at −120 mV) and the GSH conductance (d, calculated between −100 and −60 mV) and their sensitivity to DCPIB exposure (20 µM). Currents were recorded with GSH pipette solution and hypo NMDGCl bath solution as in (b). Records were obtained from 8 to 10 individual cells (Mann–Whitney test was used, **p < 0.01).

