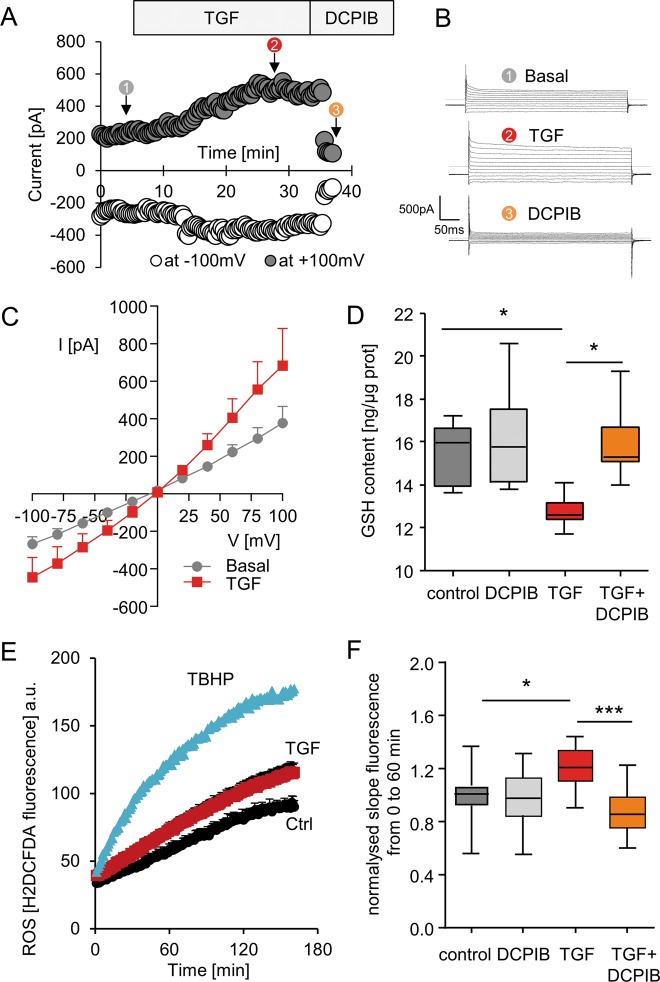
Fig. 4. Effect of TGFβ1 on LRRC8/VRAC channel activation and its contribution to the modulation of intracellular GSH content and ROS production.
a Whole-cell Cl− currents recorded at −100 and +100 mV as a function of TGFβ1 (2.5 ng/ml) exposure time and followed by a subsequent DCPIB treatment (10 µM). b Whole cell currents recorded from −100 to +100 mV by step of 20 mV for each time point (identified by 1, 2 and 3 in Fig. 4a). c Mean current-voltage (I/V) relationships measured before and after a 30 min TGF β1 exposure. Records were obtained from five individual cells. d Box plots illustrating the intracellular GSH concentrations measured in control conditions or after exposure to TGFβ1 (2.5 ng/ml; 4 h) in the absence or presence of DCPIB (10 µM) using the OPA fluorescent probe. Data were obtained from 6 to 7 measurements (three independent experiments), Kruskal-Wallis with Dunn’s multiple comparison post hoc test was used with *p < 0.05. e Kinetics of ROS production measured in HK2 cells as a function of time. Cells were incubated for 1 h in the presence of H2-DCFDA and washed, and fluorescence was measured every 2 min for 180 min in control conditions (black) or in the presence of TGFβ1 (red, 2.5 ng/ml). A positive control was obtained by adding 1 mM of tBHP as an external oxidant molecule (blue). f Box plots illustrating the normalized slope fluorescence (calculated for a period of 60 min after the addition of the various substances) as measured in (e), corresponding to cells exposed to DCPIB or TGF alone and to both substances simultaneously (TGF + DCPIB).Values were obtained from 17 to 18 measurements (five independent experiments), Kruskal-Wallis with Dunn’s multiple comparison post hoc test was used with *p < 0.05, ***p < 0.001.

