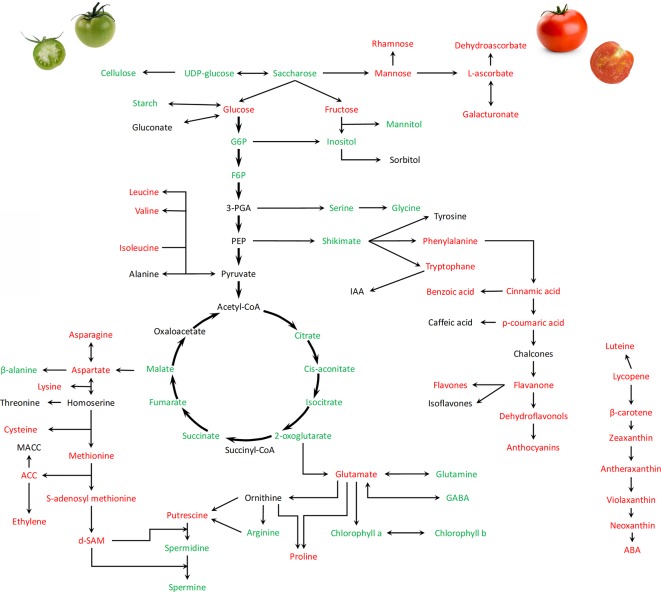
Figure 2.
Global overview of metabolic changes occurring during the transition from green expanding fruit to ripening processes (from 30 DAA to 60 DAA) in tomato fruit. Names of metabolites in red, green and black indicate increase, decrease or no changes, respectively. Metabolites are analyzed mainly in pericarps. The Figure summarizes data collected by Carrari and Fernie (2006); Gilbert (2009); Mounet et al. (2009); Centeno et al. (2011); Beauvoit et al. (2014); Biais et al. (2014), Van Meulebroek et al. (2015), Van de Poel et al. (2012), and Zhao et al. (2018).

