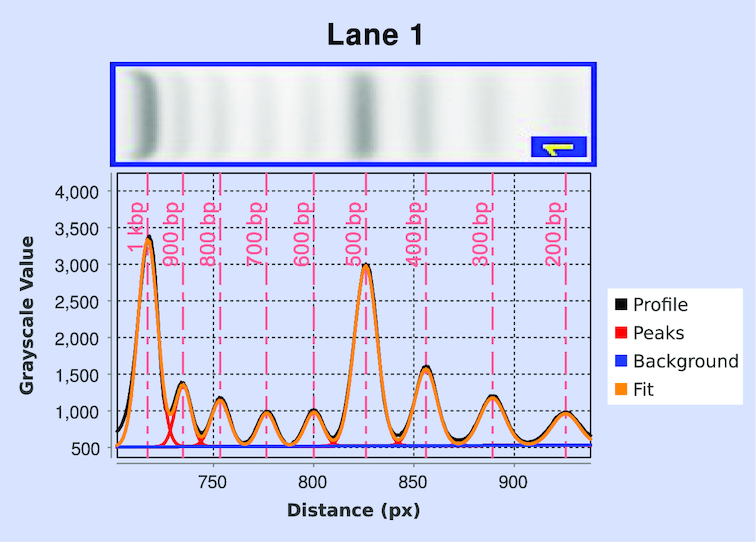
Figure 1.

Fit to a discrete profile obtained for gel lane shown in the top panel (also present in lane 1 of Figure 2A). The complete non-linear least-squares fit (orange) and its component background (blue) and Gaussian peaks (red) are shown. The vertical dashed lines (light red) indicate the locations of peak maxima, corresponding to known molecular-weight values for the ladder species.
