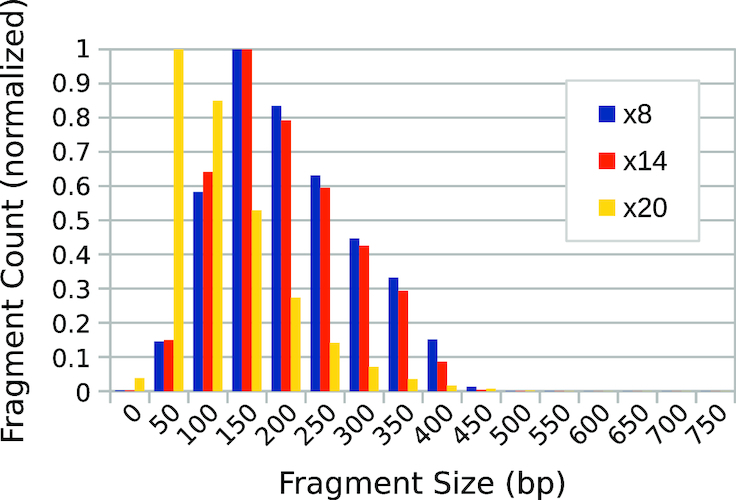
Figure 3.

Fragment-library size distributions obtained from bioinformatic analysis of MiSeq sequencing output. A tagmented sample of phage λ genomic DNA was subjected to 8, 14 and 20 cycles of PCR amplification, respectively. The fragment counts in each bin are normalized with respect to the maximum value in each distribution.
